


Mantle price rebounded more than 6% on Aug. 19 as MNT tested a key resistance level near $0.46, while liquidation data pointed to a larger pool of leveraged positions above the market.
Summary
- Mantle price rose 6.6% to approximately $0.455 during the latest daily session.
- The token is testing Fibonacci resistance at $0.4575 after rebounding from $0.39.
- Liquidation liquidity is concentrated between $0.46 and $0.49, creating a possible short-squeeze zone.
- Mantle hosted 155 tokenized equities and more than $1 billion in DeFi TVL by June.
Mantle price approaches a breakout level
According to data from crypto.news, Mantle (MNT) price traded around $0.455 after rising 6.6% during the daily session shown. The recovery extended a rebound that began after MNT reached approximately $0.39 at the start of August.
The token has since formed a series of higher lows and briefly reached $0.467 on Aug. 13. Sellers rejected that advance, but MNT held above $0.42 before returning to the upper end of its recent range.
The daily chart places immediate resistance at $0.4575, which matches the 78.6% Fibonacci retracement of MNT’s decline from $0.7149 to $0.3874. A daily close above that level would indicate that buyers have recovered the final Fibonacci barrier before the previous breakdown area.
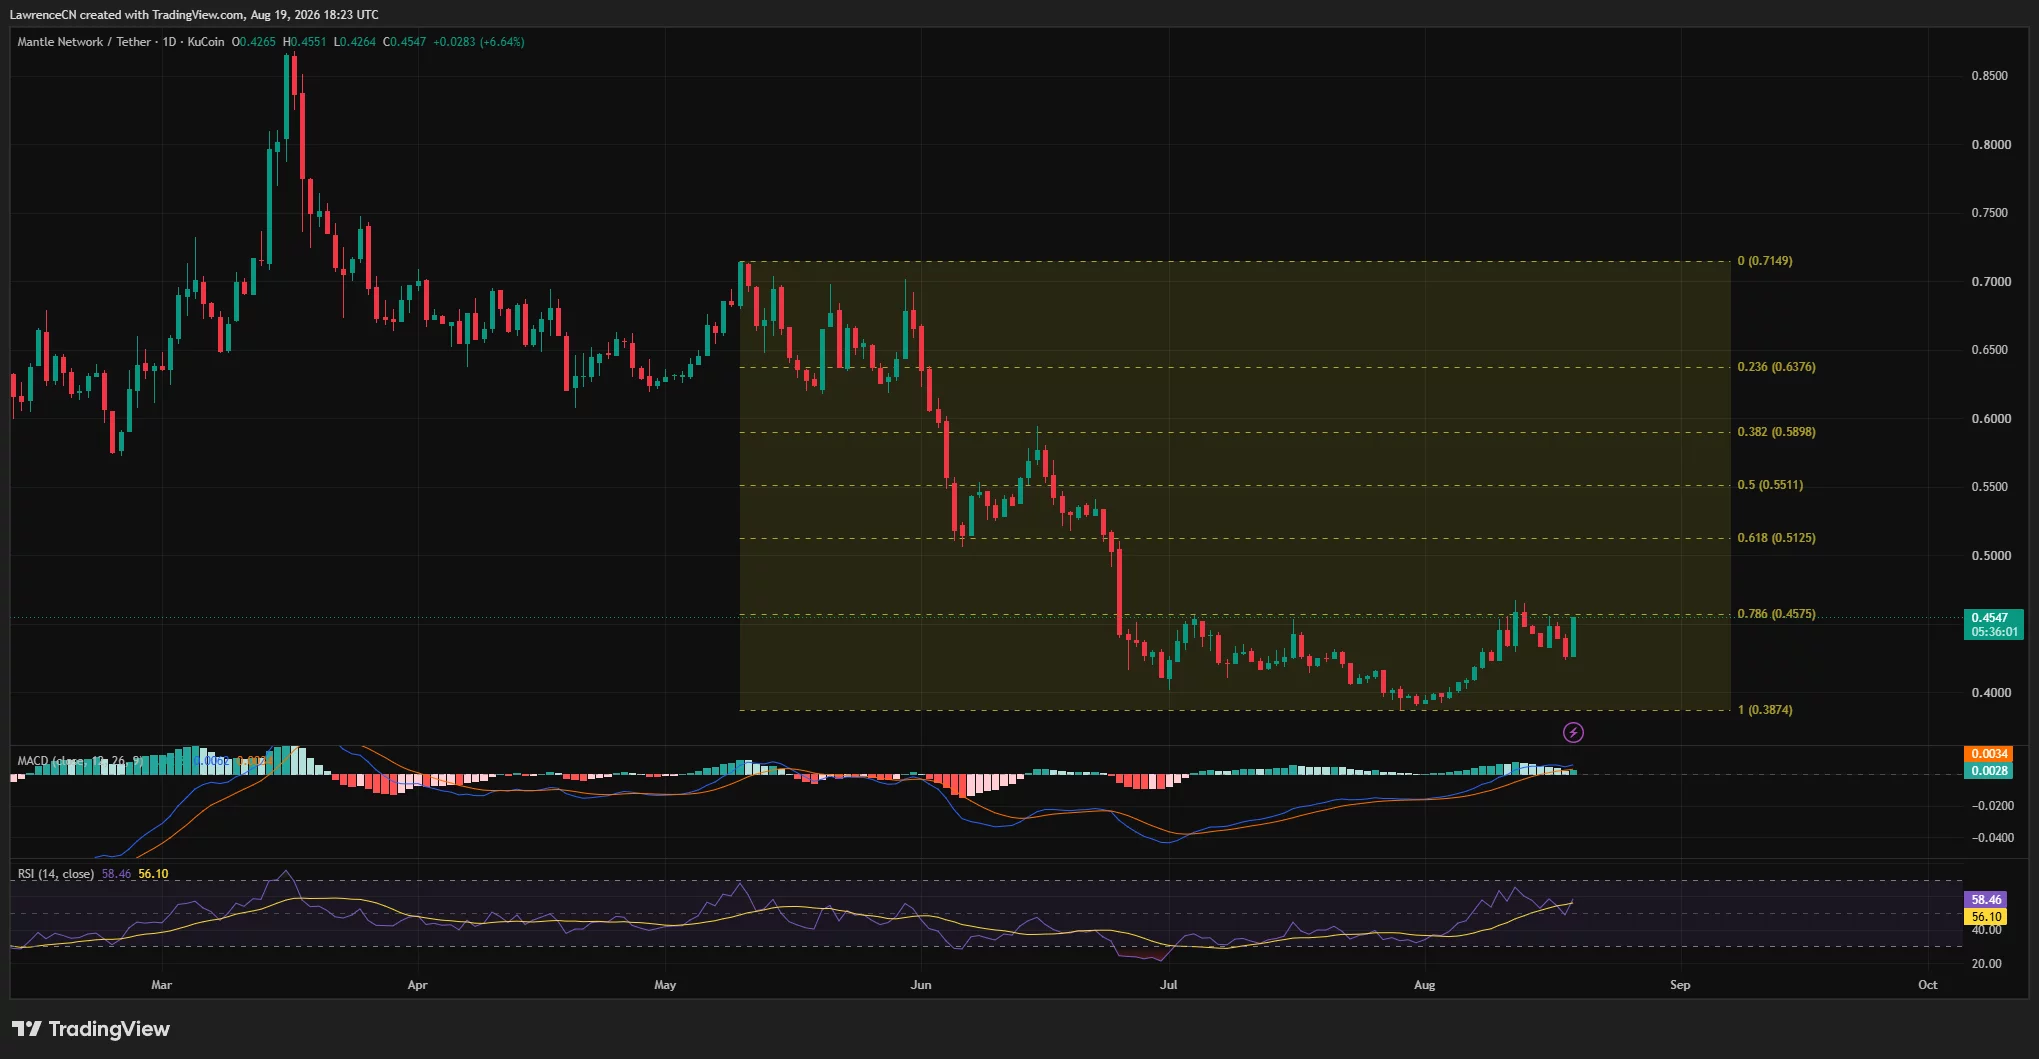
Momentum indicators support the rebound without showing an overbought market. The daily relative strength index stood at 58.46, above its signal average of 56.10 but below the 70 level commonly associated with overbought conditions.
The moving average convergence divergence indicator also remained positive. However, the small distance between its two lines showed that MNT still needed stronger momentum to confirm a sustained breakout.
Liquidation clusters could pull MNT toward $0.49
CoinGlass’ one-week liquidation heatmap showed several layers of leveraged positions immediately above MNT’s market price. The closest concentrations appeared between $0.46 and $0.47, while brighter and denser bands extended from around $0.475 to $0.49.
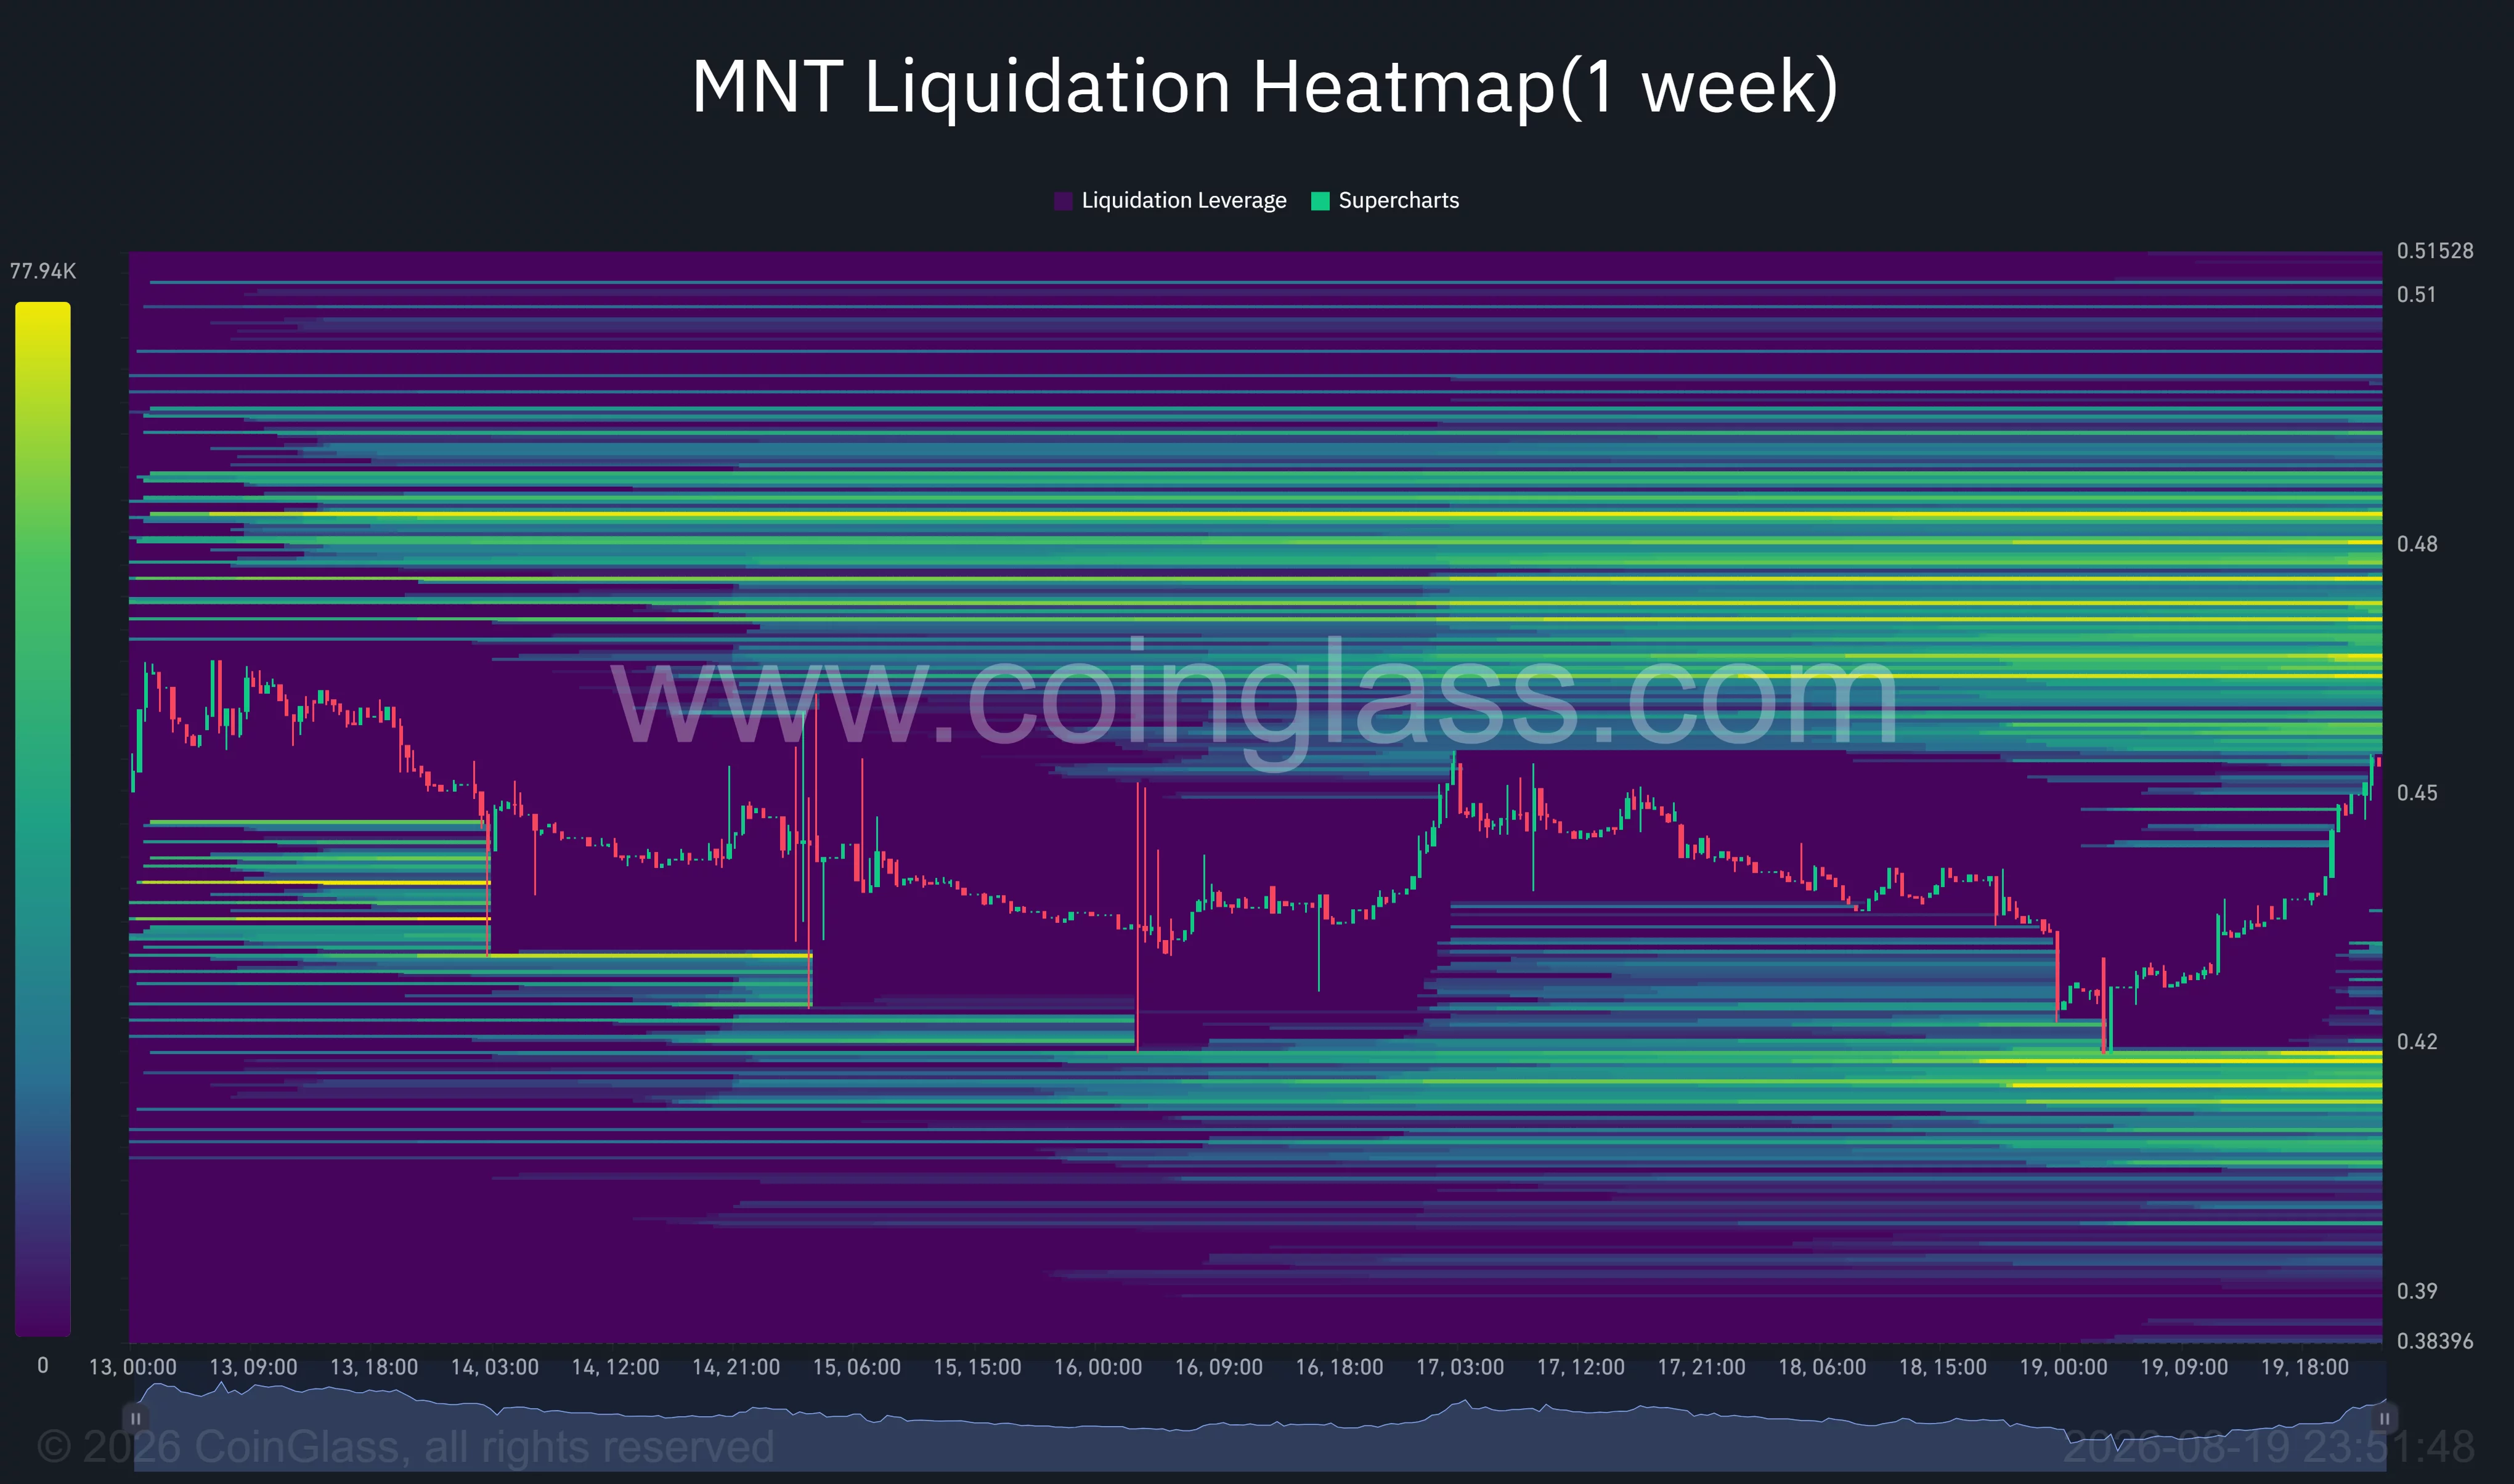
Liquidation clusters do not guarantee that price will move toward them. They mark areas where leveraged positions could be closed if the market reaches their trigger prices, potentially adding forced buying or selling to an existing move.
A break above $0.4575 could therefore expose the first liquidity band near $0.47. If rising prices force traders holding short positions to buy back MNT, the resulting pressure could push the token toward the stronger $0.48–$0.49 cluster.
The heatmap showed the nearest large downside liquidity pool between roughly $0.412 and $0.418. MNT could revisit that region if it loses recent support and leveraged long positions begin closing.
MNT must defend $0.44 to preserve momentum
The 4-hour chart showed MNT reaching $0.4547, close to the upper Bollinger Band at $0.4561. Trading at the upper band reflects strong short-term momentum, although it can also leave the token vulnerable to a pullback if buyers fail to clear resistance.
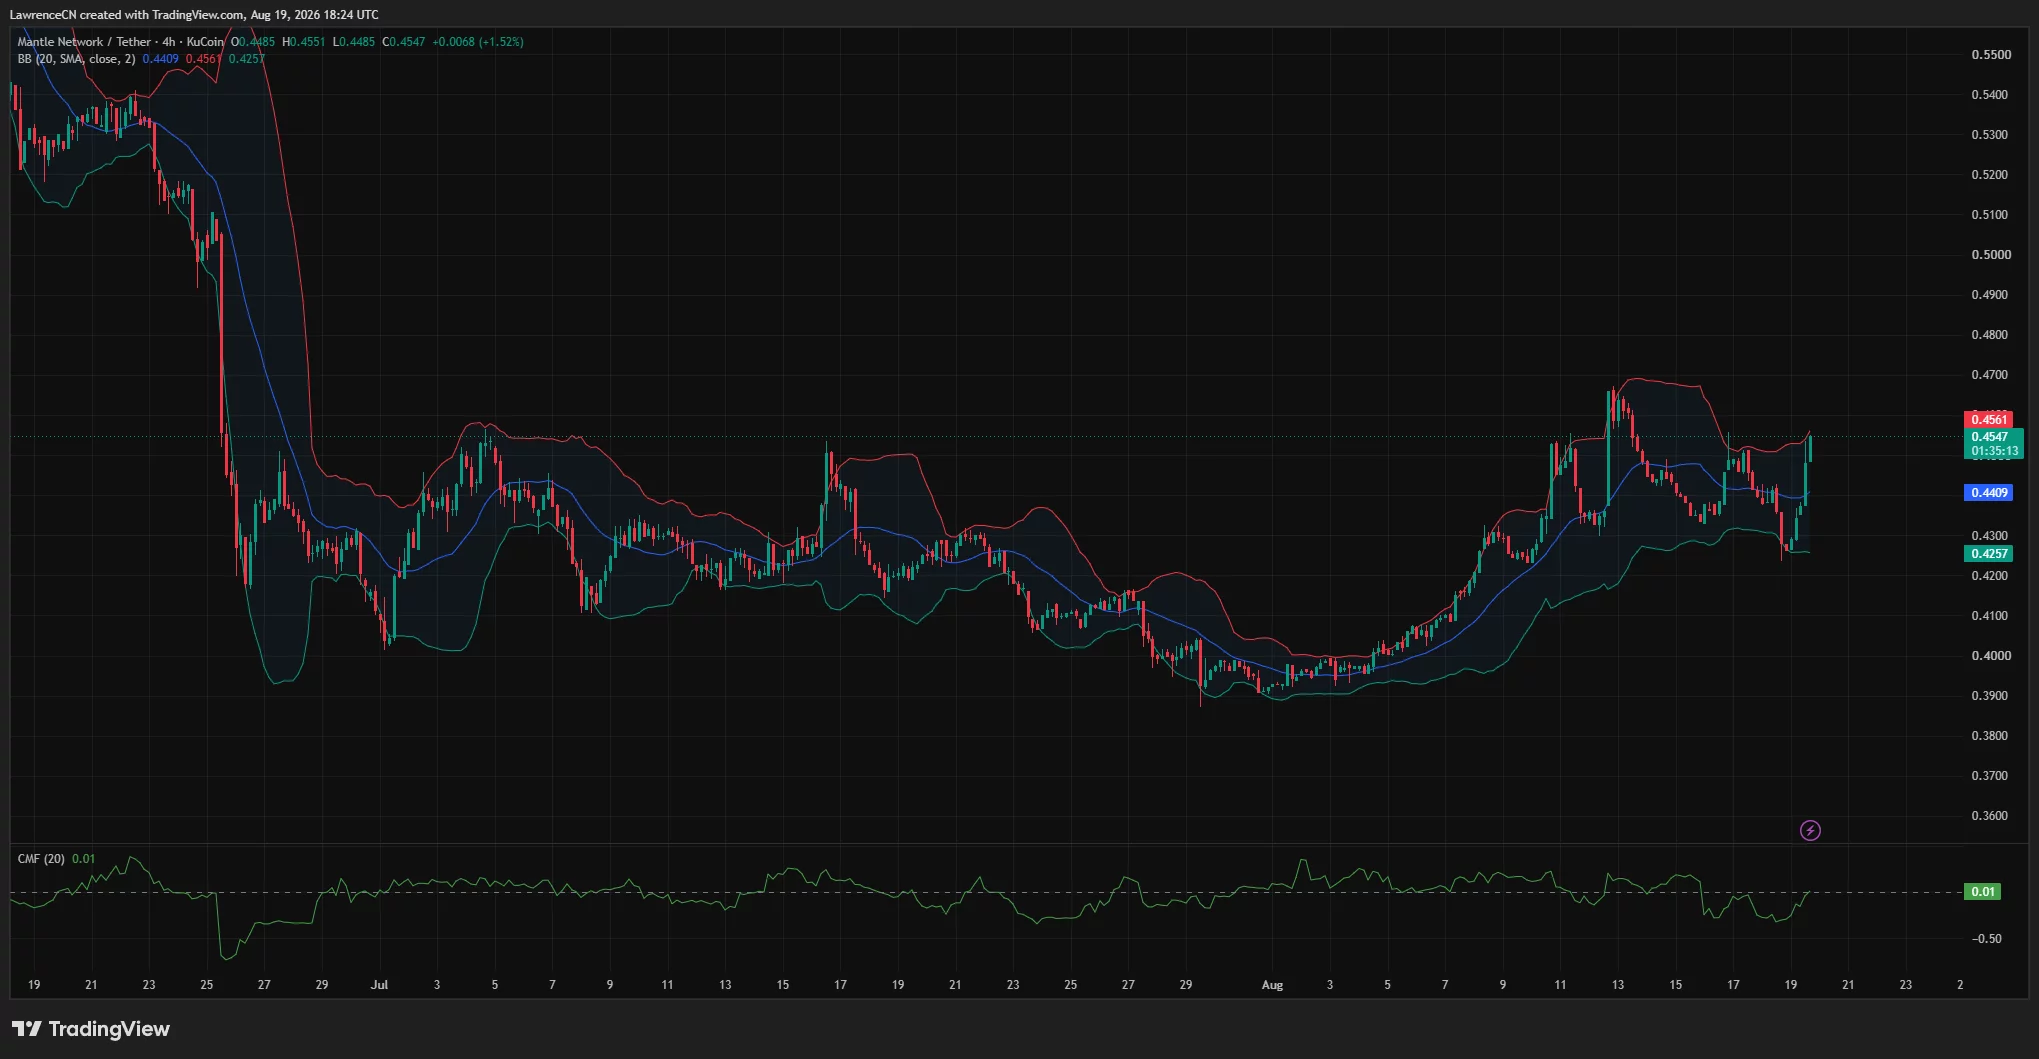
The Bollinger Band midpoint at $0.4409 forms the first support level. Holding above it would preserve the short-term upward structure and allow MNT to make another attempt at $0.4575 and $0.467.
Chaikin Money Flow stood at 0.01, indicating that buying pressure had moved slightly above neutral. The reading did not show strong capital inflows, making confirmation through higher volume important if MNT attempts to break its August peak.
A close below $0.4409 would weaken the immediate setup and expose the lower Bollinger Band near $0.4257. Further selling could bring the Aug. 19 intraday low around $0.42 back into view, followed by the larger daily support at $0.3874.
On the upside, clearing $0.467 would open a path toward the liquidation concentrations at $0.48–$0.49. MNT would then face broader Fibonacci resistance at $0.5125, followed by $0.5511.
Mantle’s tokenized asset push adds fundamental support
The rebound comes as Mantle expands its decentralized finance and real-world asset operations. A Q2 report published by Nansen said the network’s DeFi total value locked exceeded $1 billion after growing 230% during the first half of 2026.
Nansen reported that RWA-focused DeFi TVL passed $90 million, while assets managed through Mantle Vault exceeded $200 million. The network’s stablecoin market capitalization reached $955 million, representing 120% year-over-year growth, according to the report.
Mantle also increased the number of tokenized equities on its network from 10 in April to 155 by the end of June. Its lineup included products linked to SpaceX and Franklin Templeton’s U.S. Equity Index ETF, although those tokens do not provide direct ownership in the underlying companies or funds unless their terms explicitly state otherwise.
The network’s Aave market was another source of growth. Mantle said the deployment reached $1 billion in 19 days, while Nansen reported that deposits had exceeded $1.45 billion by April.
For US investors, the presence of tokenized US equities does not establish that the products are available legally in the United States. Mantle’s xStocks announcement described access as available only where permitted, leaving eligibility dependent on each platform’s restrictions and applicable securities rules.
MNT’s immediate direction now rests on whether buyers can convert the ecosystem narrative into enough spot demand to break $0.4575. A confirmed close above that level would strengthen the case for $0.48–$0.49, while losing $0.44 would put the rebound at risk.
Disclosure: This article does not represent investment advice. The content and materials featured on this page are for educational purposes only.