

XRP is trading near $1.05 as buyers continue to defend the $1 level after a weak month.
Summary
- XRP trades near $1.05 after falling sharply over the past week and month.
- ETF inflows remain positive while Bitcoin and Ethereum funds continue showing heavy weekly outflows.
- Analysts watch $1 support, rising active addresses, and possible rebound signals toward the $1.30 zone.
The token is down more than 7% over the past week and about 19% over the past 30 days, while its 24-hour range sits between $1.04 and $1.07.
The price action remains weak, but several market signals show that XRP has not lost all support. ETF inflows remain positive, daily active addresses are rising, and some analysts now point to early reversal patterns on the daily chart.
XRP trades near $1 after sharp monthly decline
XRP holds a market rank of #6, with market capitalization near $65.4 billion. Its 24-hour trading volume stands above $1.1 billion, showing that activity remains strong even as price stays near recent lows.
The token remains far below its all-time high of $3.65 from July 2025. It has also fallen more than 50% over the past year and about 49% over the past 200 days, showing that the current weakness is part of a longer downtrend.
A recent XRP price prediction noted that XRP is trading near a 20-month low. The same report said $1 has become the key level to watch, with downside support near $0.85 and $0.70 if that area fails.
That makes the current setup simple. XRP needs to hold $1 to avoid a deeper technical breakdown. A strong move above $1.12 and then $1.27 would be needed before traders can argue that momentum is shifting back toward buyers.
ETF demand stays positive despite weak price
XRP fund flows continue to stand out against Bitcoin and Ethereum. On June 26, XRP ranked first in single-day net inflows at about $15.63 million, while spot Bitcoin ETFs saw about $444.51 million in outflows and Ethereum funds lost about $12.85 million.
The weekly trend also remains positive. XRP spot ETFs have now posted seven straight green weeks, with roughly $144.69 million in net inflows over that stretch, according to SoSoValue data.
This is not the same pattern seen in Bitcoin and Ethereum. Over the same seven-week stretch, Bitcoin ETFs recorded about $7.73 billion in outflows, while Ethereum ETFs lost around $1.18 billion.
A previous fund flow report showed XRP products had already beaten Bitcoin and Ethereum for five straight weeks. Another CLARITY Act analysis said XRP ETFs had drawn roughly $1.44 billion in cumulative inflows through six weeks of buying, even as price remained weak.
That contrast is important for the current XRP price analysis. It suggests that fund demand has not been enough to lift the token yet, but it may be helping to slow deeper losses near $1.
On-chain activity and chart signals improve
Analyst Ali Charts said XRP network activity has risen over the past two weeks. Daily active addresses climbed from about 23,000 on June 14 to nearly 39,500, pointing to higher on-chain participation.
Rising active addresses can show more users interacting with the network. It does not guarantee a price recovery, but it gives traders another data point at a time when price is testing a key support level.
Ali also pointed to two bullish reversal signals on the daily chart. He said the Tom DeMark Sequential indicator printed a “9” buy signal, which can sometimes appear before a short relief rebound lasting one to four daily candles.
He also said the past three daily sessions formed a Morning Star Doji pattern. That pattern is often used by technical traders to identify a local bottom after a downtrend.
If buying volume rises from here, Ali said XRP could move toward $1.30. That level also lines up with earlier resistance areas from recent price action.
A prior XRP technical report said traders were watching $1.20 as a recovery level, with $1.24 and $1.30 as the next zones if buyers pushed through resistance.
Derivatives reset may shape the next move
Acccording to CryptoOnchain, XRP derivatives have gone through a heavy deleveraging phase. Long liquidations jumped to nearly $3 million over the past week, up more than 800% from the prior month.
Open interest also fell from about $1.18 billion to roughly $1.04 billion. At the same time, funding rates turned deeply negative, showing that traders who were positioned for upside have been forced out.
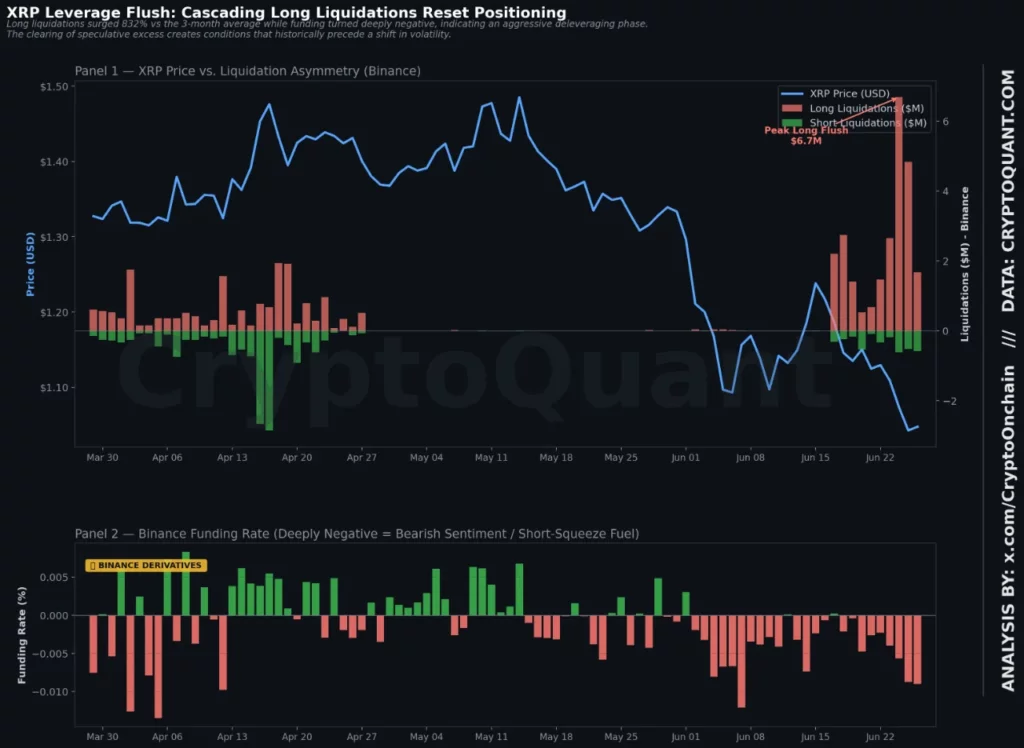
That type of reset can cut speculative excess from the market. It can also create conditions for a sharp move if short sellers become crowded and spot buyers remain steady.
The spot side looks calmer than futures. Binance reserves were nearly flat over the week, suggesting holders are not rushing to move XRP to exchanges for immediate sale.
The next signal will come from open interest and funding rates. If open interest starts to recover while price holds $1, traders may read it as a healthier reset. If XRP loses $1 with rising volume, the market may shift back toward $0.85 and $0.70 support.
Ripple’s wider ecosystem also remains in focus after RLUSD became available in Japan through SBI VC Trade. The stablecoin launch gives Ripple a new regulated channel in Asia, though XRP’s short-term direction still depends on price action, fund flows, and whether buyers can defend the $1 level.
Disclosure: This article does not represent investment advice. The content and materials featured on this page are for educational purposes only.
