Crypto analyst Master Kenobi has identified a bullish pattern for the Bitcoin price, which is similar to one that was observed in the previous bull cycle. Based on this pattern, the analyst explained why the Bitcoin price could rally to as high as $169,000 in this cycle.
Bitcoin Price Could Rally To $169,000 As Fractal Pattern Appears
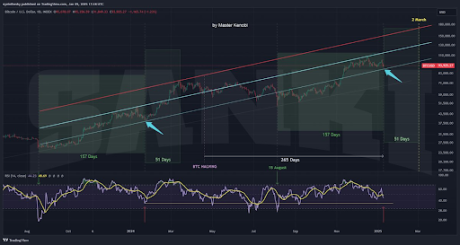
In an X post, Master Kenobi predicted that the Bitcoin price could rally to $169,000 as a similar fractal pattern from the previous bull cycle is again unfolding. The analyst noted that daily Relative Strength Index (RSI) measurements indicate that this fractal phase lasted 157 days last year.
Related Reading

Master Kenobi further remarked that the Bitcoin price replicates this 157-day sequence for the current period, then this fractal phase began on August 5, 2024, and ended yesterday. Therefore, according to the fractal, this bullish phase should begin today. The crypto analyst added that the exact duration of this bullish period cannot be determined. However, after the 157-day fractal last year, Bitcoin entered a 51-day rally.
In line with this, he asserted that if the Bitcoin price follows the same pattern this year, the rally could end on March 2, with BTC reaching $169,000 by then. Master Kenobi also went further to analyze the charts. The crypto analyst mentioned that the accompanying chart has been slightly adjusted, with trendlines now originating from the peaks reached during the cycle.
For symmetry and additional confirmation of history repeating itself, the crypto analyst remarked that it would be ideal if the Bitcoin price action closes near the trend line that aligns with the same zone from last year. Although this is not essential, he explained that such a close would strengthen the fractal’s alignment. If this scenario unfolds, Master Kenobi warned that BTC could first fall to between $88,000 and $89,000.
Meanwhile, the crypto analyst noted that the number of days in this cycle may not be identical to last year and could extend slightly longer. This would allow sufficient time for the BTC price to reach its target along both the trend line and the horizontal yellow RSI line.
BTC Bull Market Still Intact
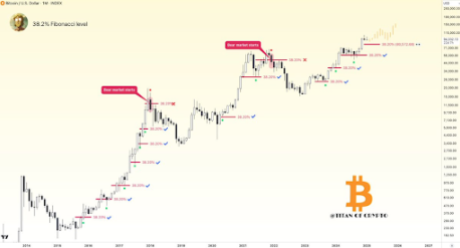
In an X post, crypto analyst Titan of Crypto affirmed that the Bitcoin price bull market is still intact. He revealed that this bullish momentum will continue as long as Bitcoin maintains a monthly close above the 38.2% Fibonacci retracement level.
Related Reading

The Bitcoin price has been on a downtrend since December last year and recently crashed below $93,000. However, Titan of Crypto suggested that this wasn’t out of place. He noted that BTC surged by 120% from August to December. As such, the crypto analyst explained that a correction is natural as the market digests this rally.
At the time of writing, the Bitcoin price is trading at around $94,000, down in the last 24 hours, according to data from CoinMarketCap.
Featured image created with Dall.E, chart from Tradingview.com


