

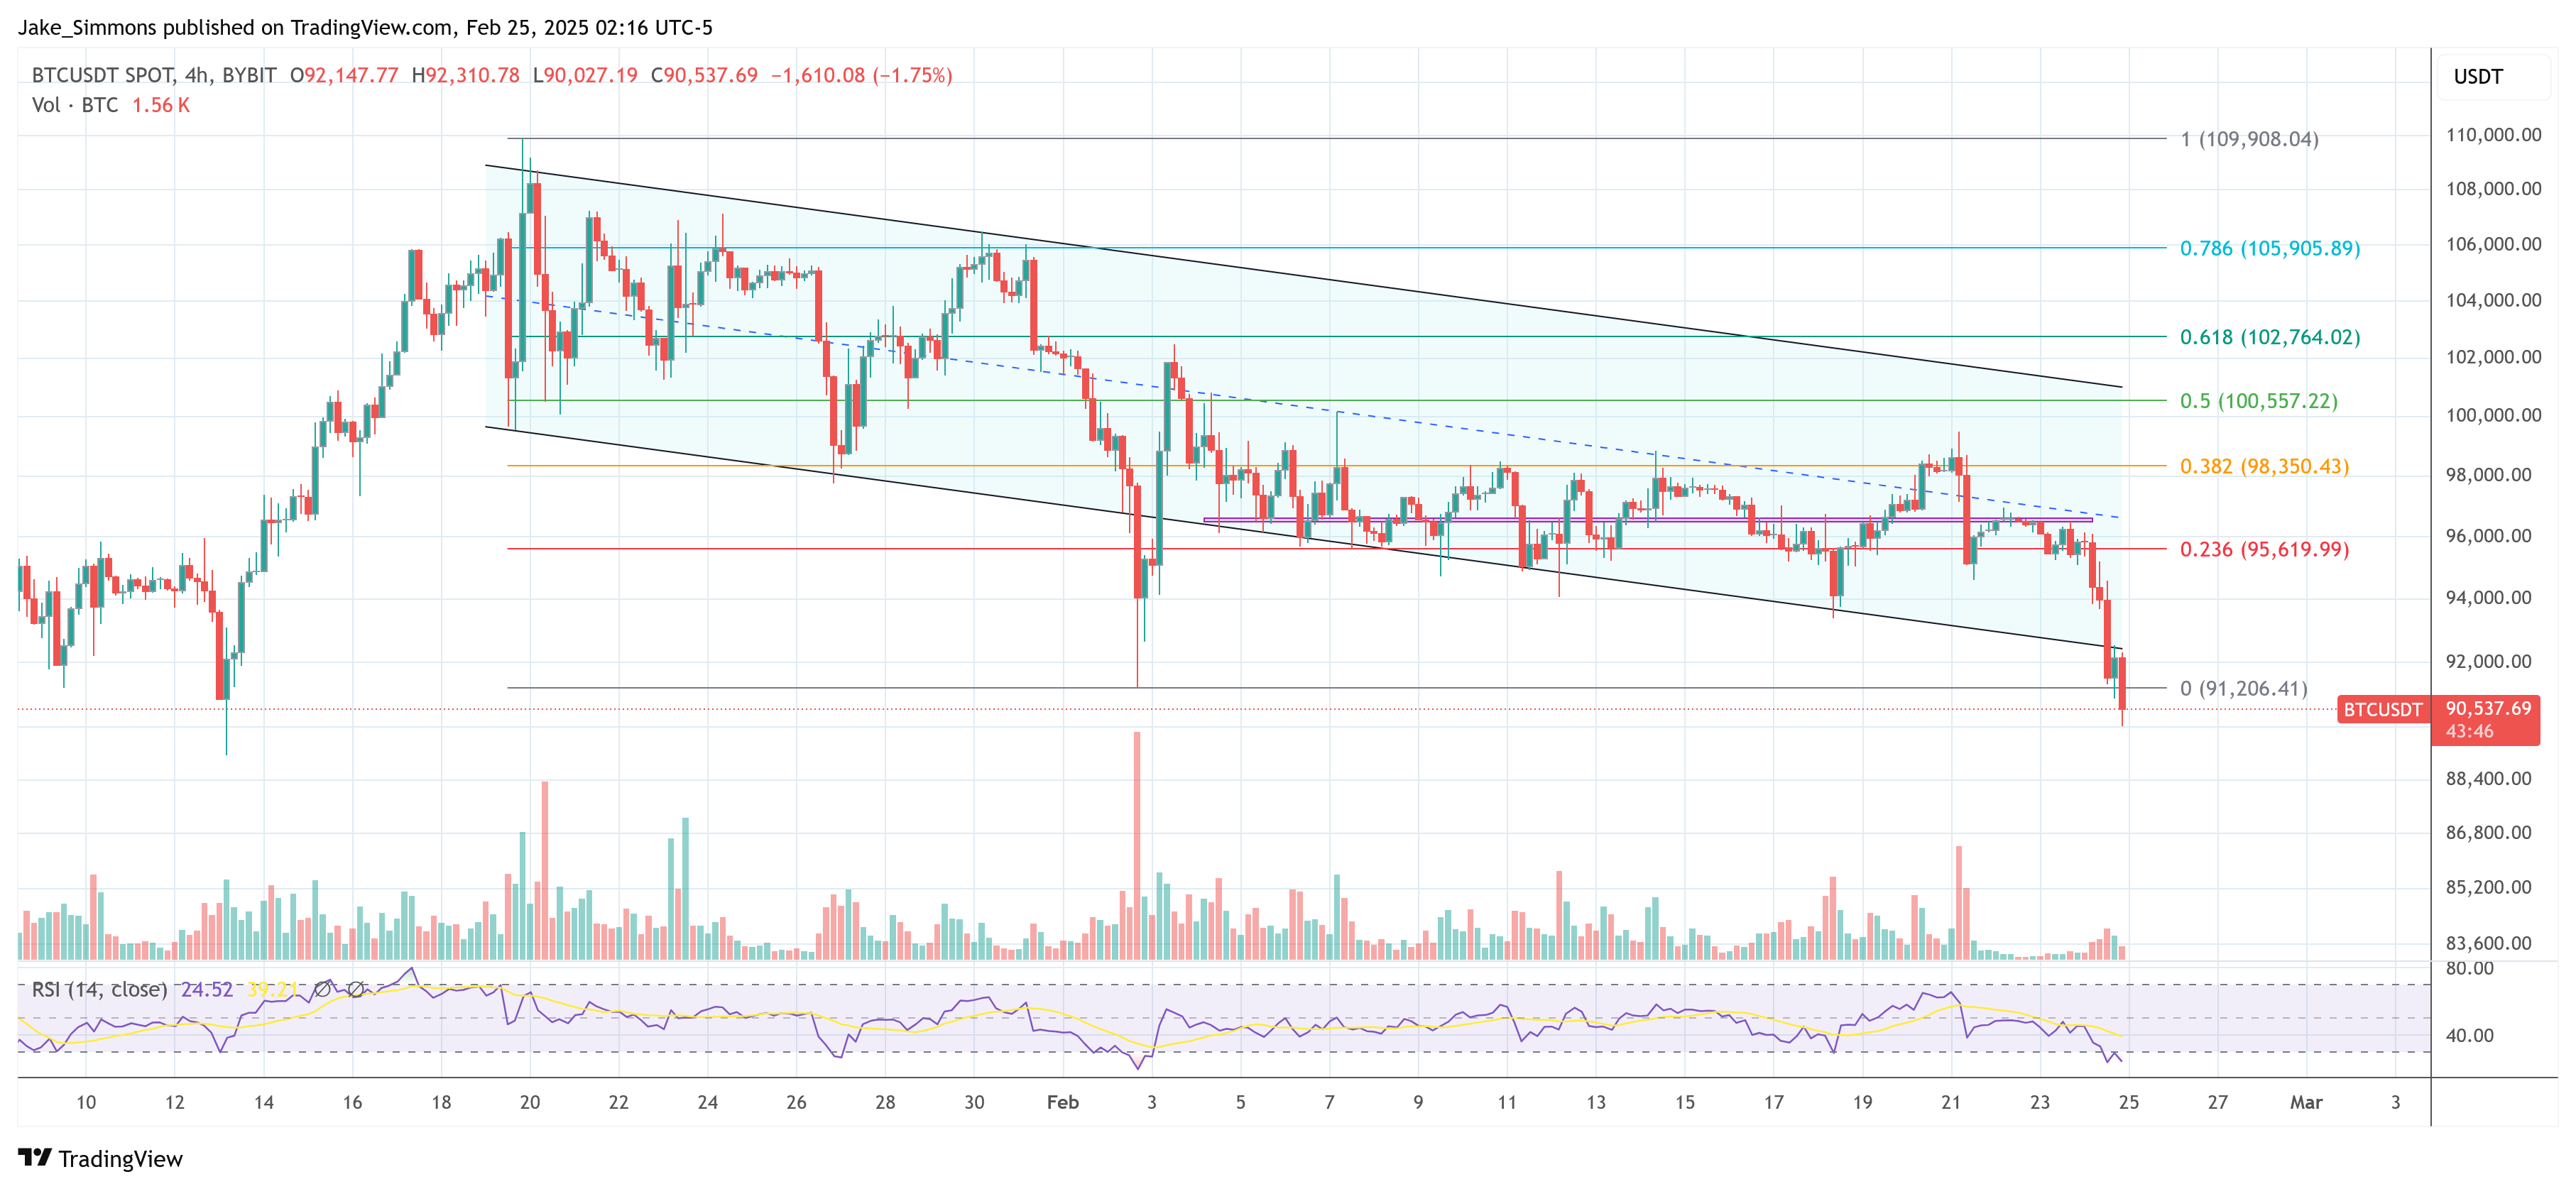
The Bitcoin price has fallen more than -8.8% since Friday when Bybit suffered the biggest crypto hack in history. The flagship digital asset reached a peak of $99,493 late last week, only to retreat to roughly $91,500 at press time, marking a -5.5% decline since Monday. This downturn not only shatters Bitcoin’s attempt to hold above $95,000 but also places it on the verge of losing its critical 97-day trading range between $91,000 and $102,000. Notably, Bitcoin’s price has broken below the descending trend channel that has been in play since January 20.
What’s Next For Bitcoin?
Ari Paul, co-founder and Chief Investment Officer of BlockTower Capital, offered a wide-ranging view on Bitcoin’s trajectory and the broader macroeconomic environment. In a post on X, Paul touched on the potential for continued equity-market weakness and its knock-on effect on digital assets: “My market take: equities in for 4-15 months of pain (I’ll guess 9 months) tied to deflationary government policies (tariffs and mass layoffs mostly). Then it’s a political question – does Trump admin ‘capitulate’ and turn severely inflationary? In vast majority of similar cases in history the answer was yes, but just a low confidence guess to me currently.”
Related Reading
Shifting focus to crypto, Paul emphasized that while cryptocurrencies may still display short-term correlations with equities, they are inherently on different cyclical rhythms: “What does that mean for crypto? I continue to think crypto and equities are on different cycles rhythms, but that doesn’t negate shorter term correlation. Alts probably follow equities down at least at first (but they’re already down so much, even versus 2021 prices, they may bottom well before equities.)”
Speaking on Bitcoin, Paul predicts that the leading cryptocurrency will “act like a blend of gold and S&P 500,” adding, “if gold remains strong, than that would suggest Bitcoin would outperform losing equities, but maybe not by much. A retrace to ~$73k-$77k seems plausible, I’d probably add there.”
Despite the near-term volatility, Paul remains optimistic: “I remain confident crypto bull market not over, but this is looking increasingly different from prior cycles, maybe substantially slower and longer. My base case is that crypto will lead the general macro inflation turn, so maybe crypto bull run resumes in 6 months and equities turn up in 9. The dates given are just indications of my guesstimates. I place no weight on the exact timeframes.”
BitMEX founder Arthur Hayes also took to X to warn of an imminent downward push. He pointed to the mechanics of Bitcoin Exchange-Traded Funds (ETFs) and futures market arbitrage as potential drivers of increased selling pressure.
“Bitcoin goblin town incoming: Lots of IBIT holders are hedge funds that went long ETF short CME future to earn a yield greater than where they fund, short term US treasuries. If that basis drops as BTC falls, then these funds will sell IBIT and buy back CME futures. These funds are in profit, and given basis is close to UST yields they will unwind during US hours and realise their profit. $70,000 I see you mofo,” he writes.
Related Reading
Notably, research firm 10x Research published an analysis on Monday indicating that while Bitcoin ETFs—led by BlackRock’s IBIT product—have garnered $38.6 billion in net inflows since their January 2024 launch, much of this capital may not represent straightforward bets on rising BTC prices, aligning with Hayes’ statement.
“Although Bitcoin ETFs have attracted $38.6 billion in net inflows since their January 2024 launch, our analysis suggests that only $17.5 billion (44%) represents genuine long-only buying. The majority—56%—is likely tied to arbitrage strategies, where short Bitcoin futures positions offset inflows,” the firm noted.
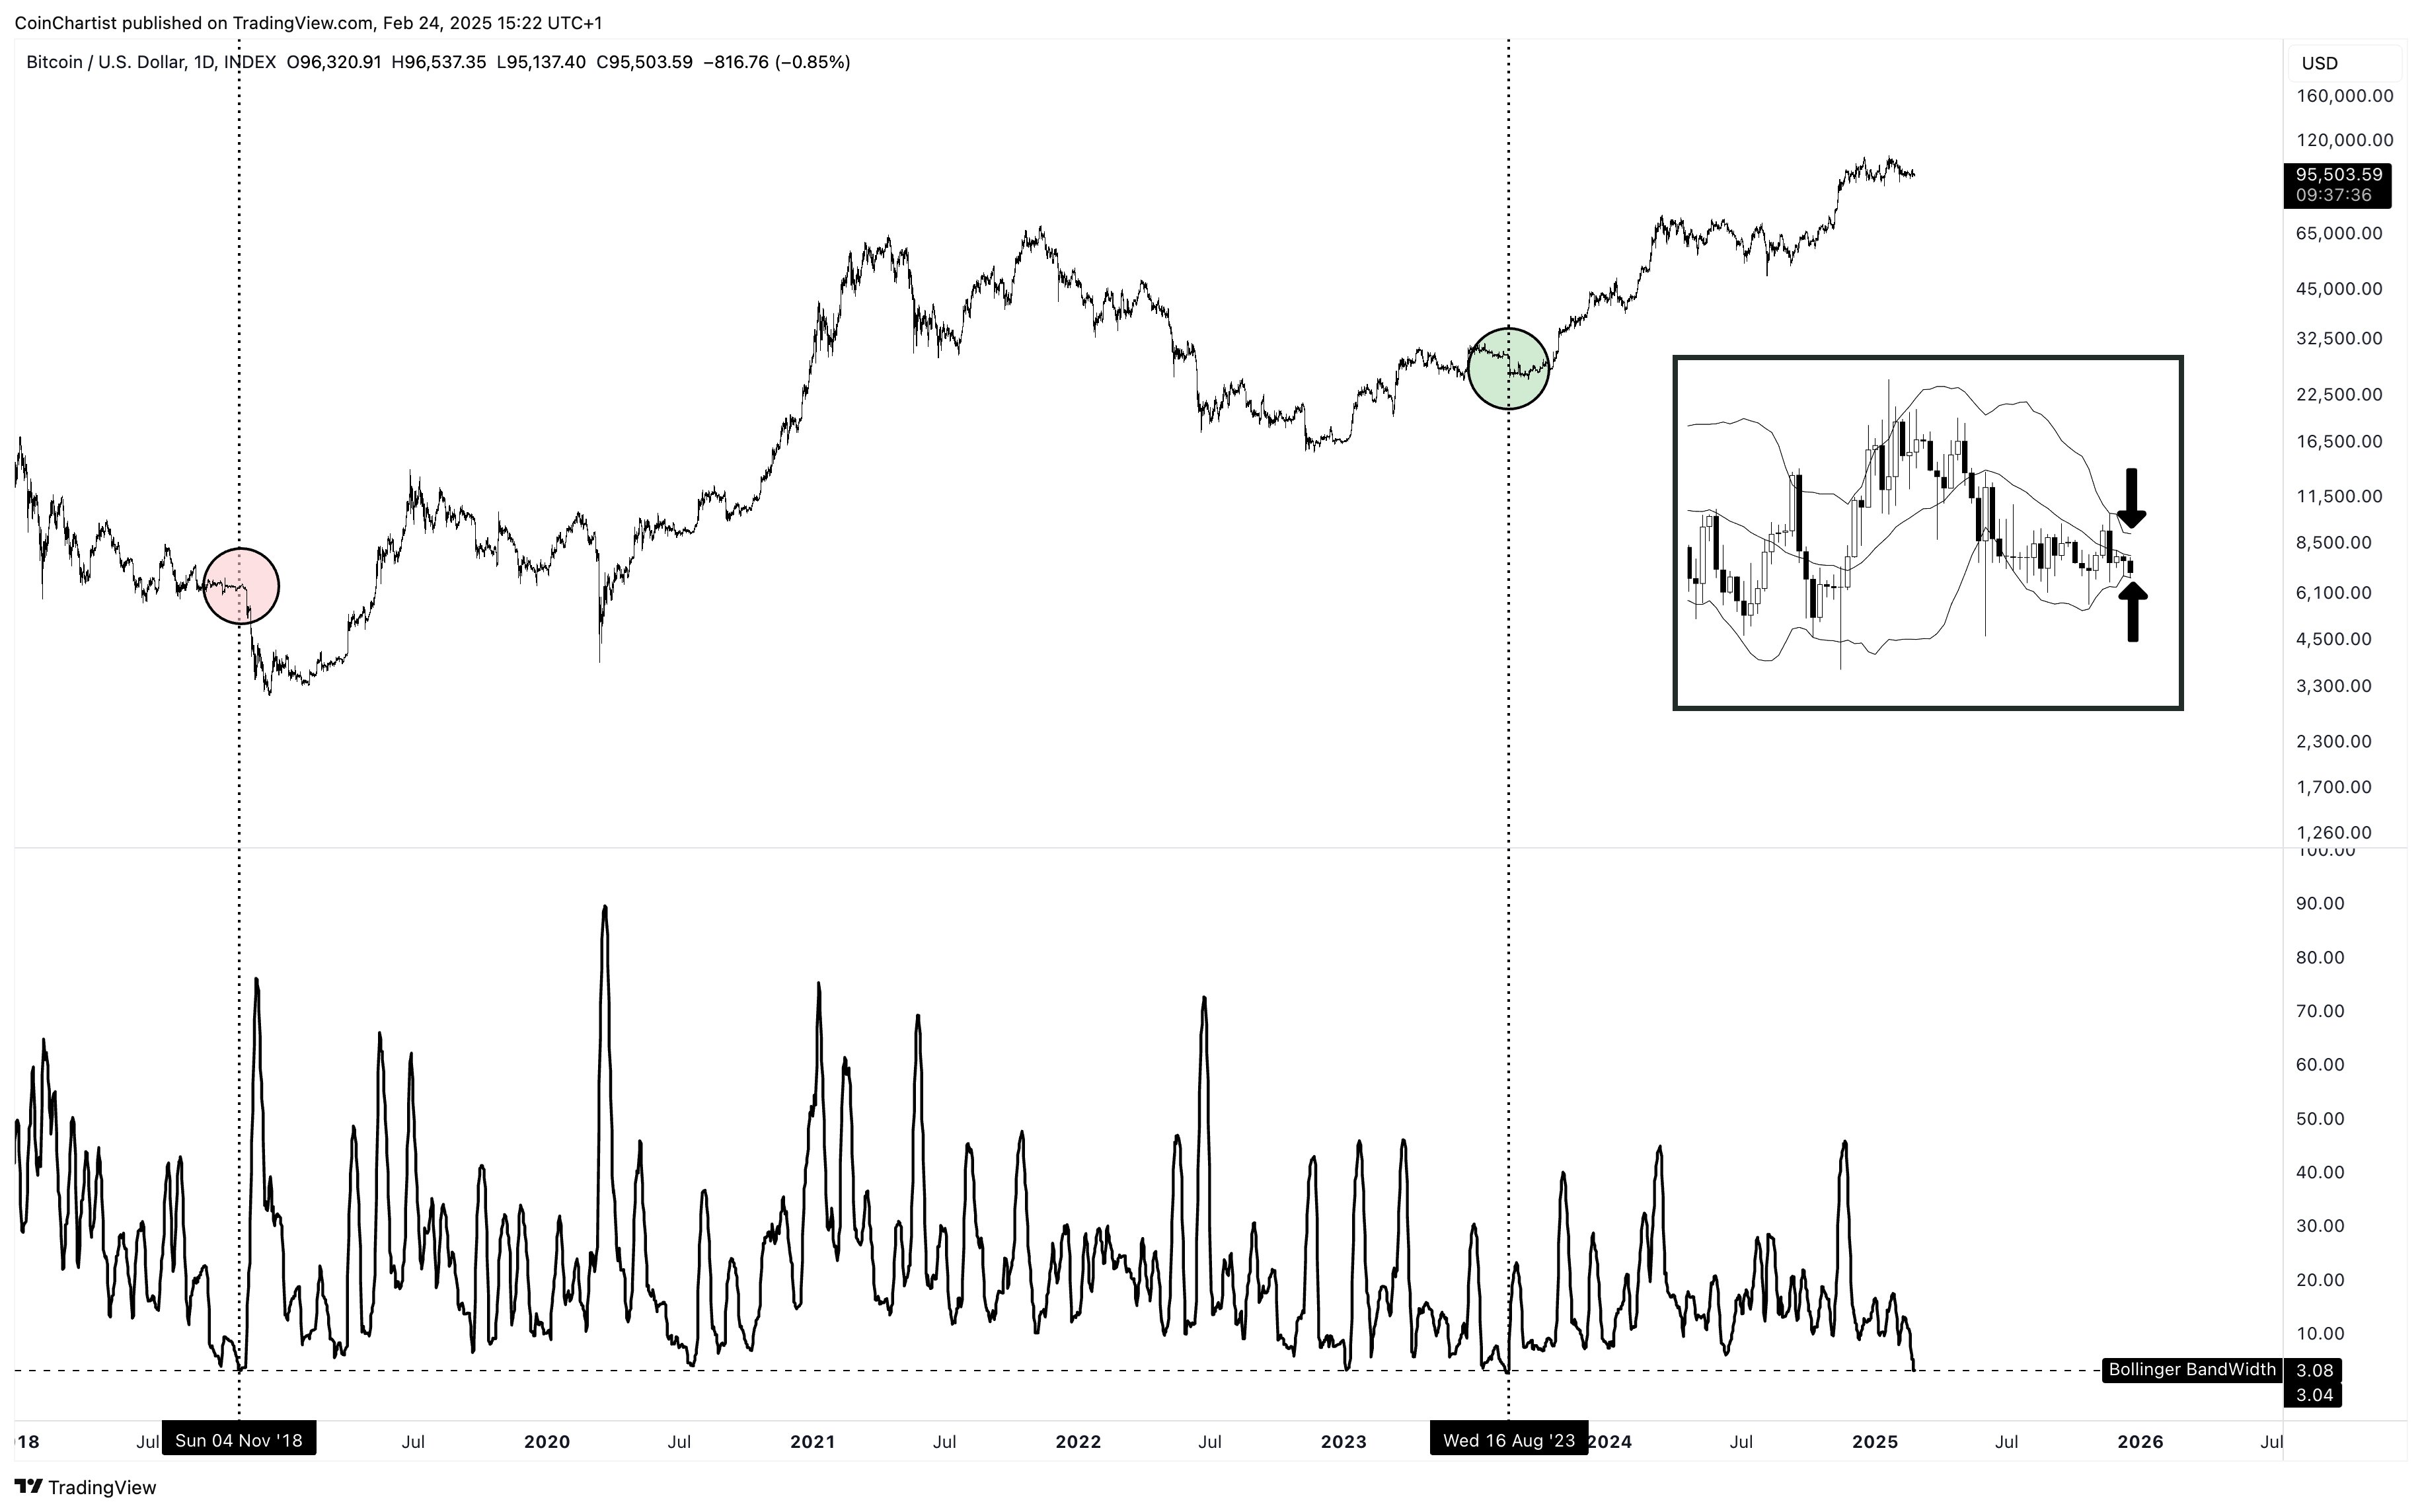
Prior to the ongoing price drop, market technician Tony “The Bull” Severino, warned of looming volatility in Bitcoin, noting that the daily Bollinger Bands were hitting extreme tightness—a pattern often followed by a significant price swing: “A decision will be made soon in Bitcoin, as the daily Bollinger Bands reach the third-tightest reading since 2018. In late 2018, record tightness led to a 50% decline in just over a month. In mid 2023, record tightness led to a 200% climb in just over 200 days. Which direction does volatility release?”
With Bitcoin teetering just above $91,000 and the market still reeling from Bybit’s historic hack, the market is at a pivotal juncture. Chart signals, macroeconomic uncertainties, and the unwinding of complex trading strategies collectively draw a clouded outlook with a possible extension of this slump to the $73,000–$77,000 range in the coming months.
Meanwhile, this does not have to herald the beginning of the bear market. Chris Burniske, partner at Placeholder VC, commented via X: “In the middle of 2021:BTC drew down 56%, ETH drew down 61%, SOL drew down 67%, many others 70-80%+. You can come up with all the reasons for why this cycle is different, but the mid-bull reset we’re going through isn’t unprecedented. Those calling for a full blown bear are misguided.”
At press time, BTC traded at $90,537.
Featured image created with DALL.E, chart from TradingView.com
