

In a post on X today, crypto analyst Satoshi Flipper (@SatoshiFlipper) shared a daily chart of DOGE/USDT on Binance that highlights what he calls a “monster falling wedge.” The chart shows Dogecoin’s price moving within two converging trendlines—one descending from the coin’s recent swing highs, and the other descending at a shallower angle from its short‐term lows, forming a classic wedge structure.
Buy Or Sell Dogecoin Now?
According to the chart, Dogecoin is currently trading in the $0.21–$0.22 range, hovering just above the wedge’s lower boundary. This trendline extends from the coin’s mid‐December levels—when Dogecoin first began its downward trajectory—through its successive lower lows, culminating near the apex in early March. Meanwhile, the upper boundary of the wedge connects a series of descending peaks from the coin’s local highs, including one in mid-January, sloping downward into the same apex region.
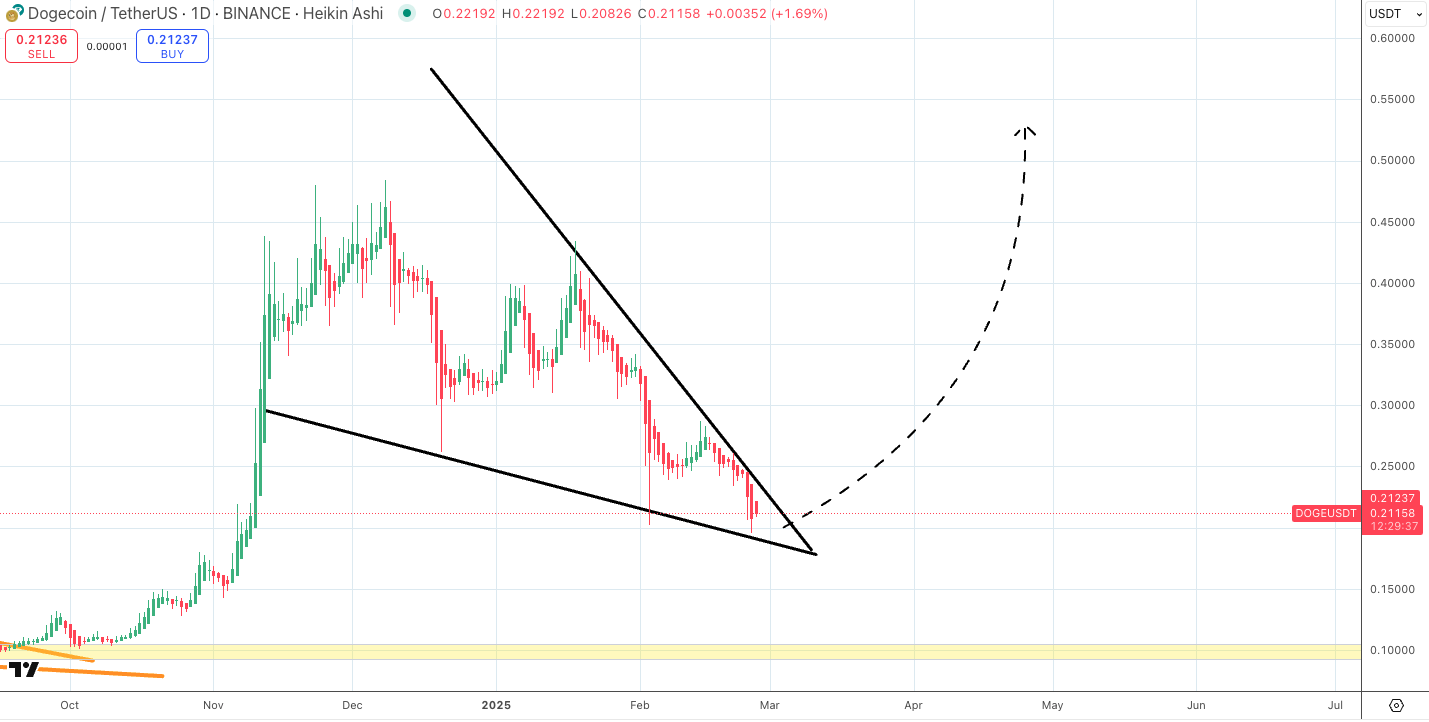
A ‘falling wedge’ is typically viewed by technical traders as a potential bullish reversal pattern, particularly when accompanied by decreasing volume during the consolidation phase. The idea is that as sellers become exhausted, buyers may begin stepping in near the wedge’s support line, driving price momentum upward once the resistance line is broken.
Related Reading
In the chart Satoshi Flipper shared, a dashed arrow projects a possible bullish move if Dogecoin can decisively break above the wedge’s top boundary. While no guarantees exist in crypto markets, this hypothetical trajectory arcs from current price levels around $0.21 to as high as the $0.50 region by late-April. The chart also shows a notable horizontal support zone below the market, hovering around $0.10–$0.15, which dates back to Dogecoin’s earlier base before its large run‐up.
Meanwhile, sentiment among other crypto analysts on X appears divided. Carlos Garcia Tapia (@CAGThe3rd) cautions that he sees “h patterns everywhere” and suggests a potential retracement before the next leg down: “Sad to say, this is all cooked, bois. DOGE 14 cents :(“
In response to another user who was unfamiliar with the “h pattern,” Tapia reiterated his view of a likely downward move. “Pretty much a retracement before the next leg down,” he stated. “This contrasts with the more optimistic stance from Suzzy | DeFi (@SuzzyDefi), who highlighted a strong wick off the $0.19–$0.20 support zone:
Related Reading
“Took a glance at DOGE, and I just spotted a strong wick off the $0.19 – $0.20 support, giving me serious bullish vibes! Buyers are stepping in, and if we see a green candle next, DOGE could be heading toward $0.25+ soon.”
At press time, DOGE traded at $0.20635.
Featured image created with DALL.E, chart from TradingView.com
