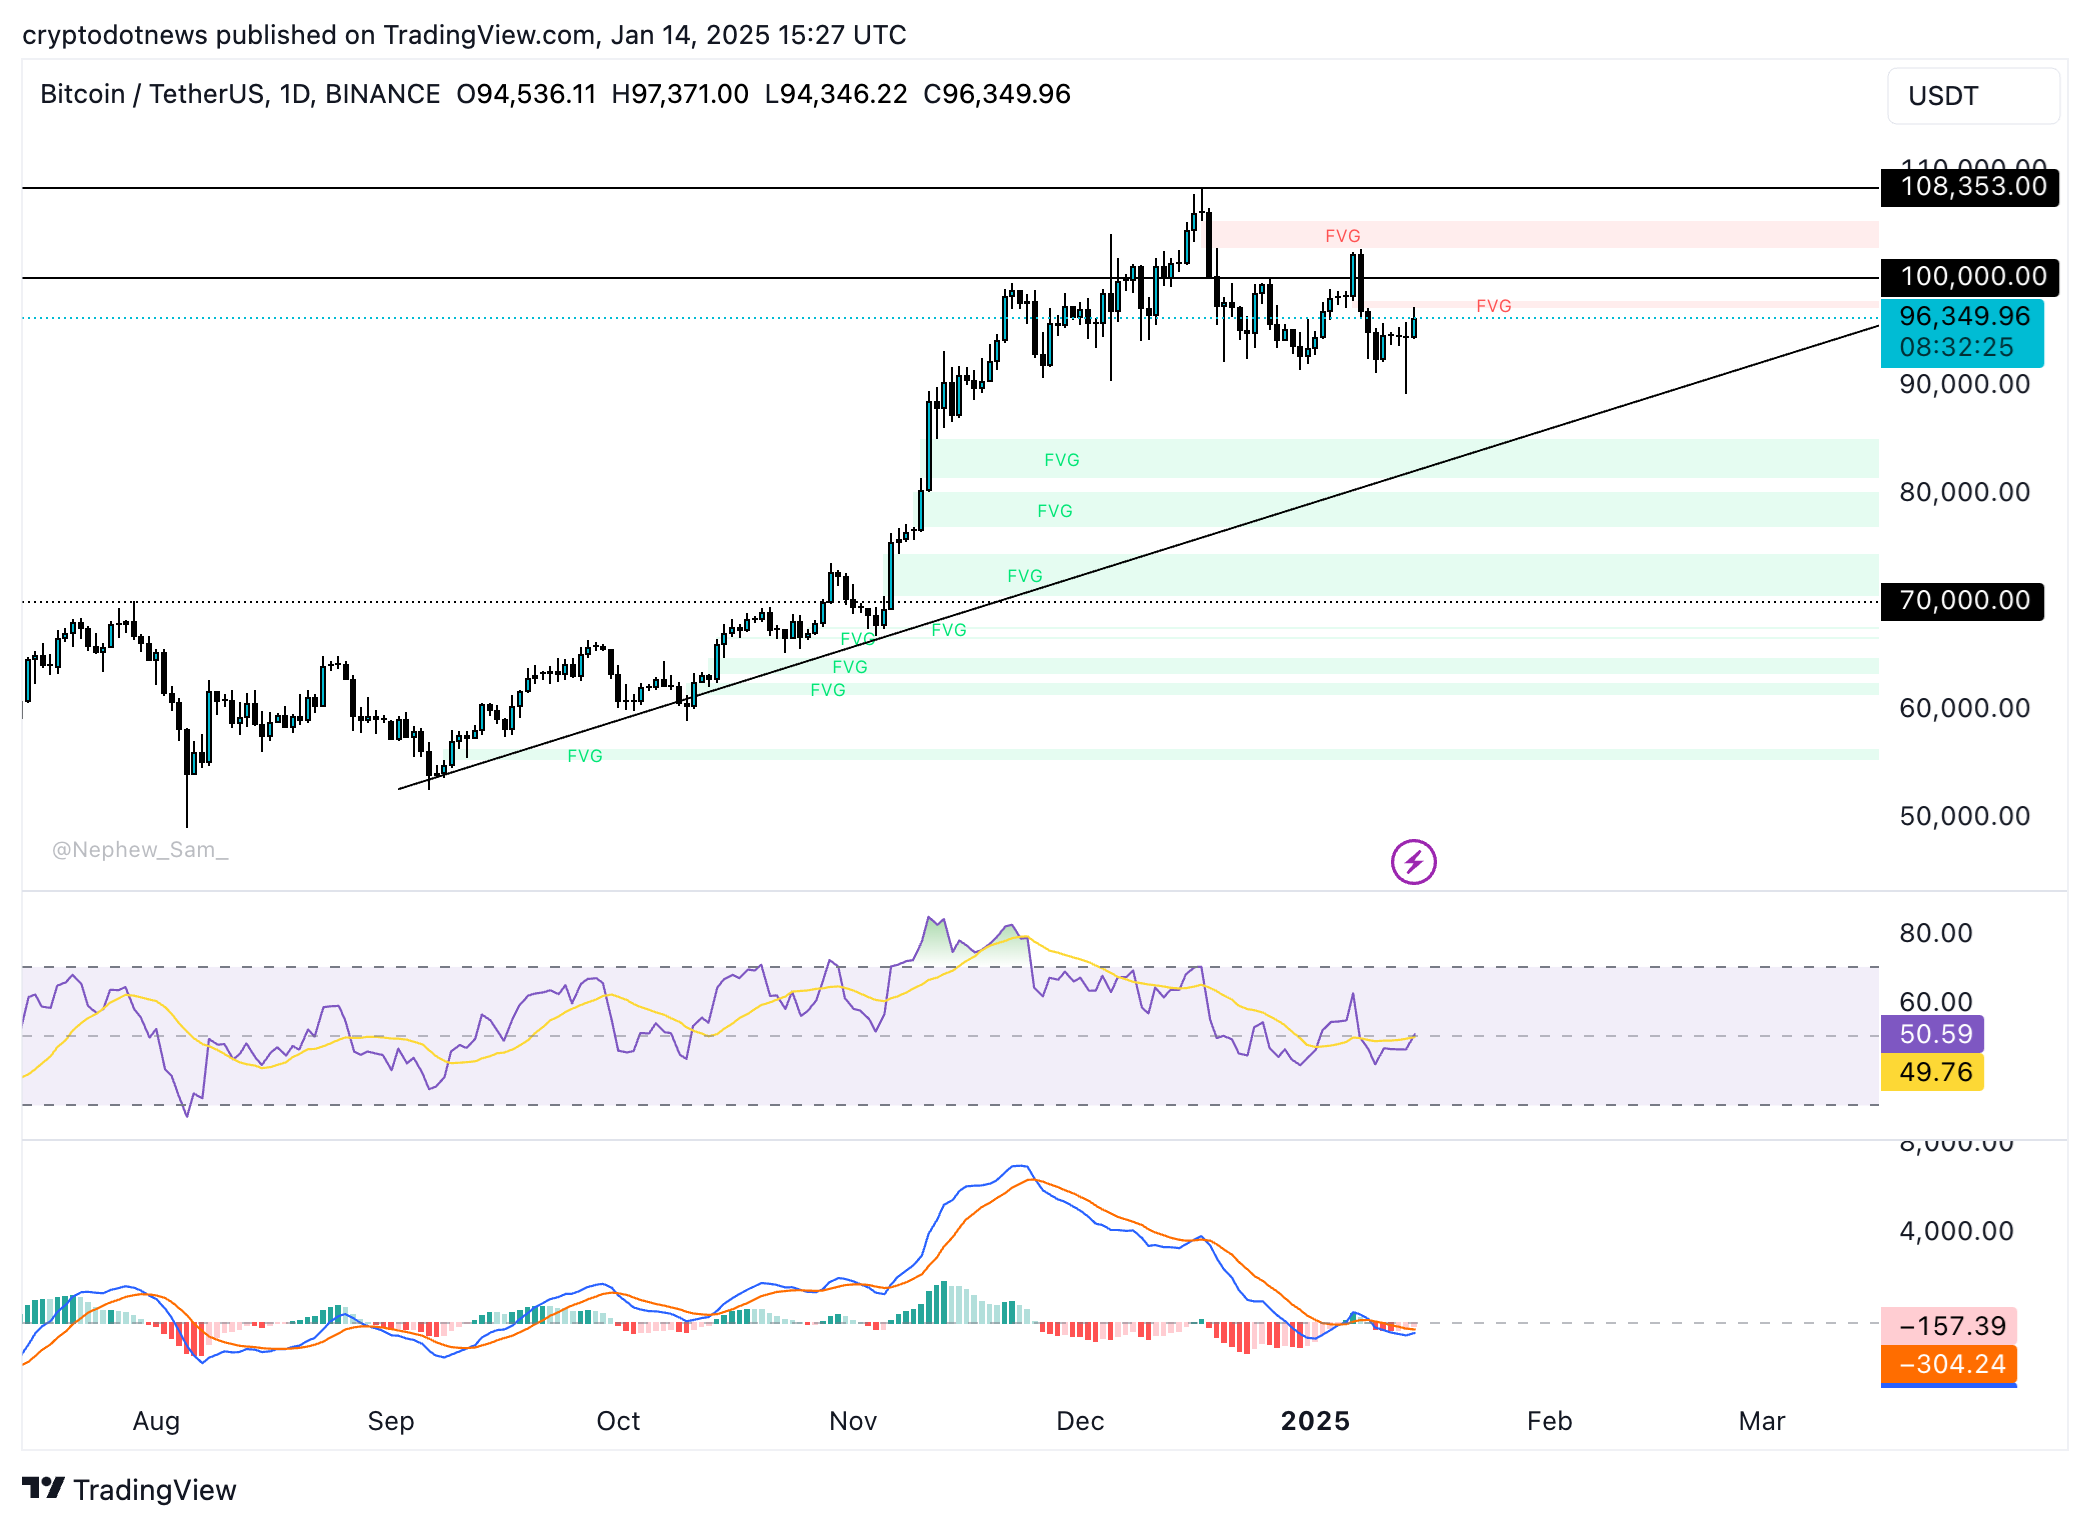
Bitcoin trades above $96,000 on Tuesday, January 14. The largest cryptocurrency has recovered from a flash crash under $90,000 and macroeconomic headwinds last week. Large scale profit-taking could push BTC to the support zones on the weekly chart, close to the $70,000 level.
Bitcoin market movers and the Trump effect
President elect-Donald Trump’s inauguration on January 20 is a key event that traders keep their eyes peeled. Trump looms large over cryptocurrencies, with his pro-crypto picks for Securities and Exchange Commission Chair, AI & Crypto Czar, and an expectation of pro-crypto regulation.
Bitcoin price trend has grown increasingly intertwined with U.S. macro moves in the past few weeks. BTC and crypto represent one of the most easily liquidable risk assets, influencing their price with macroeconomic updates.
Bitcoin started the day lower, opening above $94,000, and covered lost ground, reaching a high of $97,371 in today’s trading session.
The President-elect has been clear on his expectations from the Federal Reserve and promised a strategic Bitcoin reserve for the U.S. Crypto traders are concerned since the central bank is independent and the incoming President will not play a role in its decision-making.
The Bitcoin Act proposed by Senator Cynthia Lummis would establish a Strategic Bitcoin Reserve in the U.S., and dollar-denominated debt would be used to buy 1,000,000 BTC, or just under 5% of the total fully diluted supply of Bitcoin in the next five years.
Traders are watching for the “Trump effect” on Bitcoin’s price trend closer to the inauguration next week.
Bitcoin analysts at 10X Research remain cautious ahead of Trump’s term. Analysts observe that market drivers are weak, and Bitcoin is likely to remain range-bound until mid-March.
Even as crypto’s post-election honeymoon phase ends, the crypto industry that donated $238 million in the previous election cycle helped secure 298 pro-crypto lawmakers in Congress. It remains to be seen whether the relationship is reciprocal and could influence Bitcoin price in the long term.
Institutional appetite for Bitcoin cools down, sentiment deteriorates
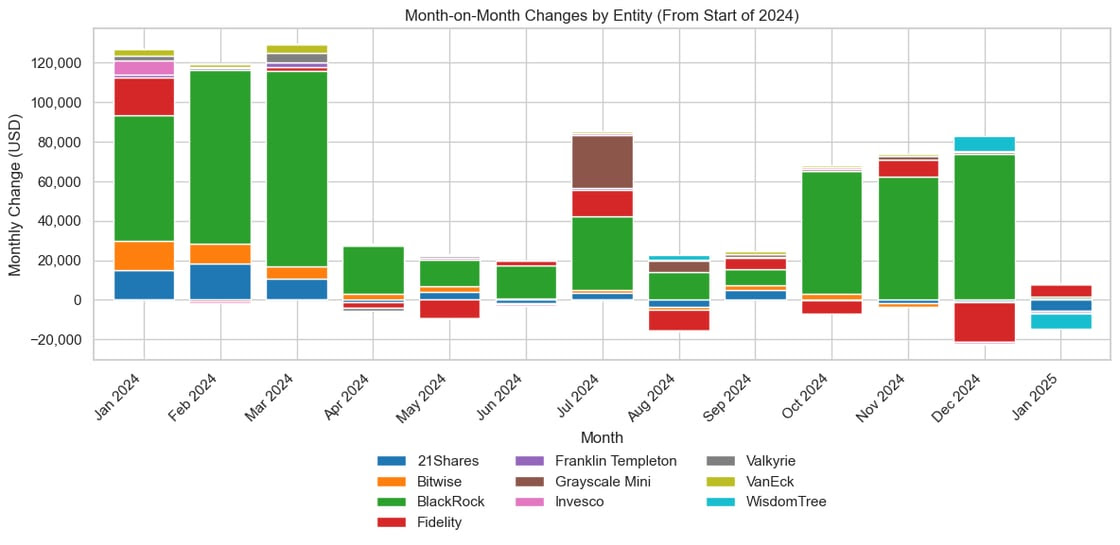
AmberData research on Bitcoin ETF dynamics shows that institutions have drastically scaled back their inflows to U.S.-based Spot Bitcoin ETFs and likely paused new allocations amidst the recent price retreat. The move signals a risk-off behavior by institutional investors.
Bitcoin traders’ short-term caution is likely to be followed by renewed conviction as BTC rallies towards its milestone of $100,000. As Bitcoin price stabilizes above $95,000, it could make or break the next leg of inflows to Spot Bitcoin ETFs.
Research suggests that sustained inflows from major players like BlackRock would signal restored confidence, while continued outflows by 21Shares or Franklin Templeton might reinforce a risk-off narrative. Traders should monitor ETF allocations closely to predict Bitcoin price trends, to determine whether the asset consolidates or tests new levels in the coming weeks.
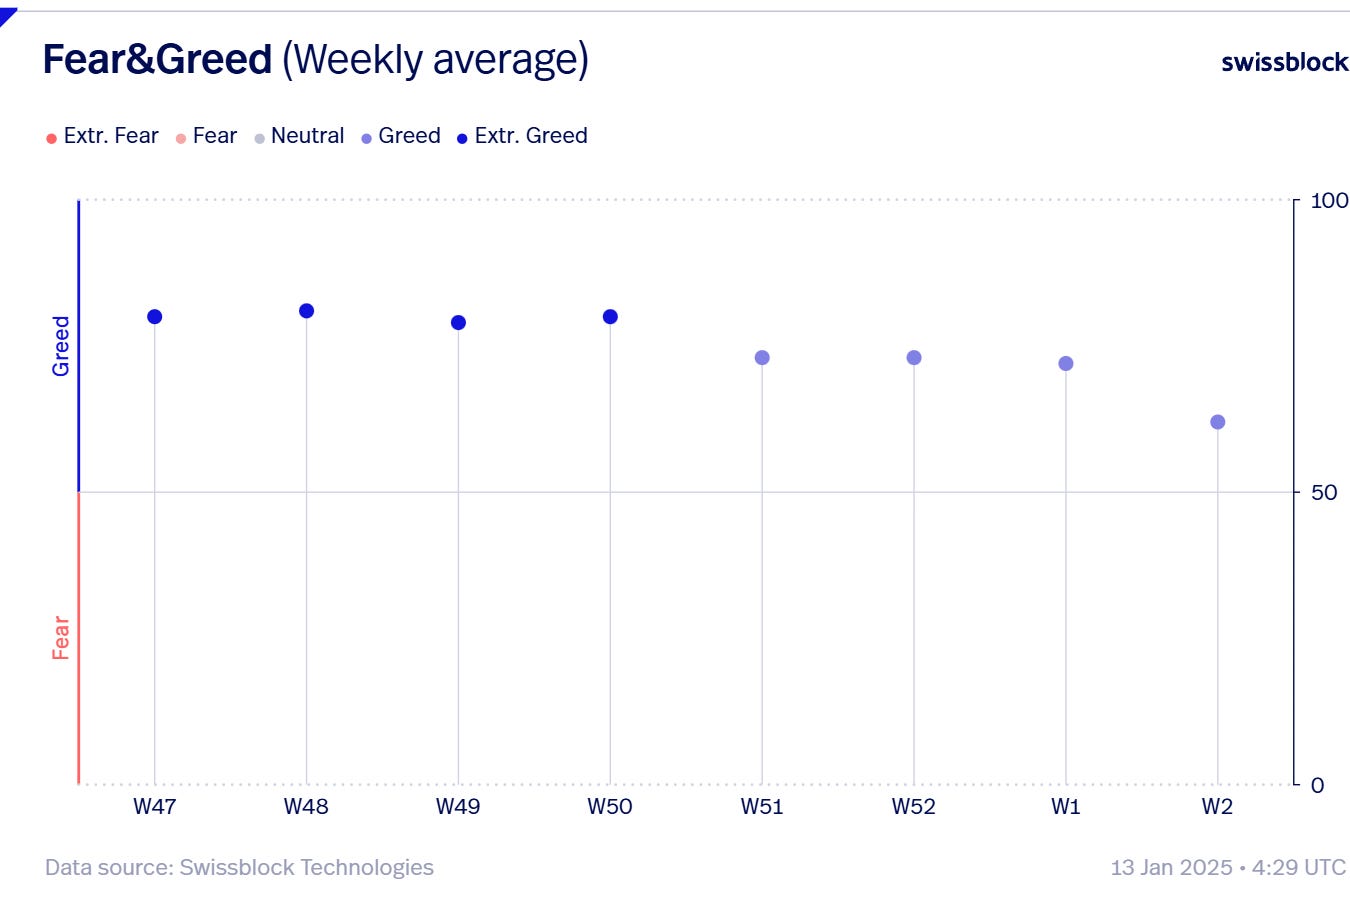
Data from Swissblock insights maps the deterioration of BTC sentiment in the first two weeks of January. As Bitcoin slipped to its $90,000 low, it raised caution among traders and sent the fear and greed index lower.
Bitcoin on-chain and derivatives data analysis
Coinglass data shows that Open interest and options trade volume has climbed in the past 24 hours. As derivatives traders position themselves for a continued upside ahead of Trump’s inauguration, sudden BTC price moves could trigger a slew of long liquidations and leave the traders exposed to the negative impact on their portfolio.

The current optimism among derivatives traders, evident from the long/short ratio (greater than 1) on exchanges like Binance and OKX, can be attributed to an expectation of a crypto-friendly Trump regime.
The Bitcoin log chart and Market value to realized value ratio on 10X Research shows that the token is reaching levels that are historically associated with profit-taking by “smart money,” meaning large wallet investors and institutions. The MVRV ratio has reached 2.7x, this typically triggers profit-taking by BTC holders, as observed in previous instances.
Historically, when the MVRV ratio rises to 4x or 6x it marks the onset of a major correction in Bitcoin price.

When on-chain analysis is combined with an anticipated hawkish stance by the U.S. central bank for several months, there is a strong probability of Bitcoin price testing support at $76,000 and potentially $69,000, a dip under the $70,000 mark.
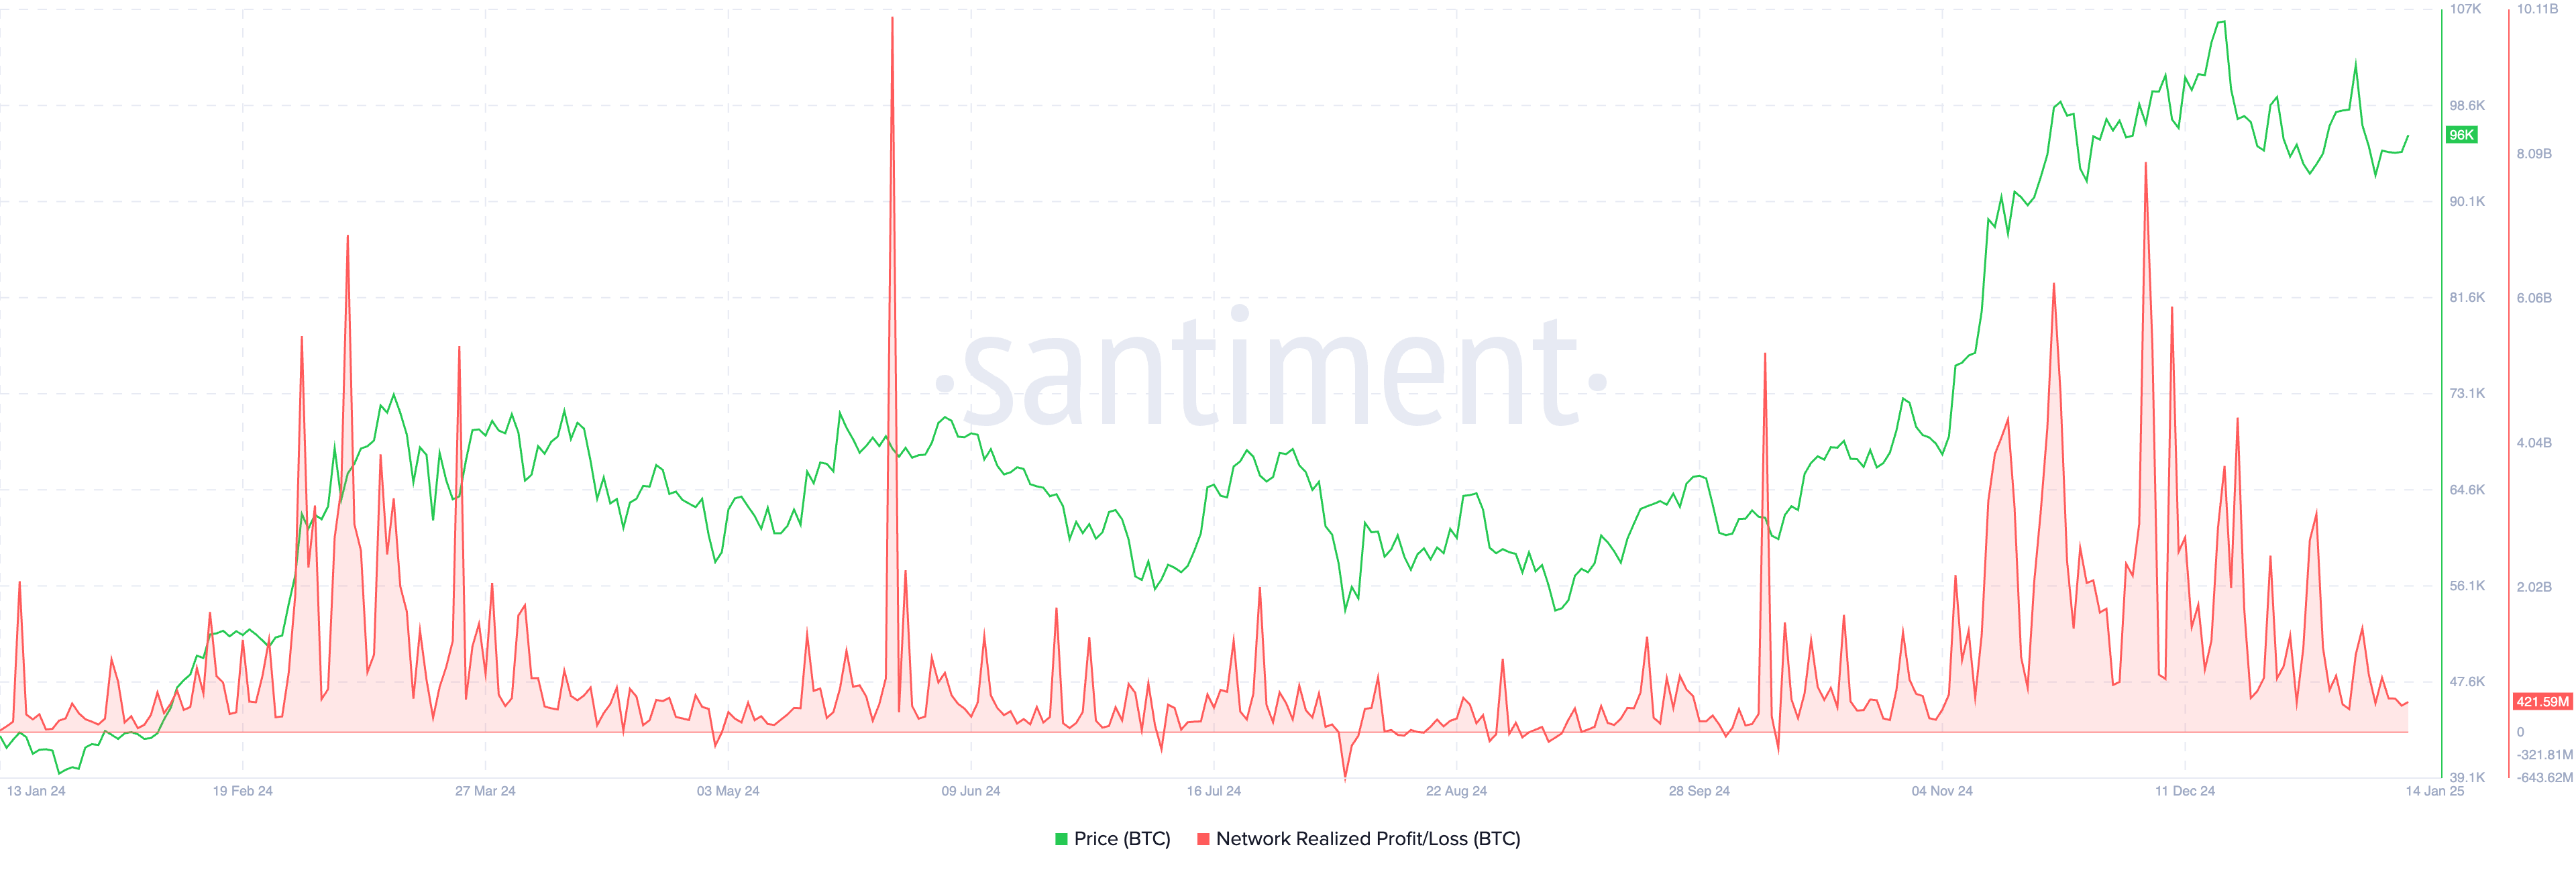
The Network realized profit/loss metric on Santiment nods in agreement with the MVRV ratio and deteriorating sentiment among traders. Consistent profit-taking spikes over extended time periods are associated with a correction in Bitcoin price.
In a tweet on X, Keith Alan, co-founder of Material Indicators, warned crypto traders of a potential decline to Bitcoin’s 2021 all-time high of $69,000. Alan considers $86,000 as a key support level and the $76,000 level as the secondary support.
If Bitcoin suffers a steep correction and fails to bounce off the two support levels, it could dip under the $70,000 level.
Sergei Gorev, head of risk, YouHodler, told Crypto.news in an exclusive interview:
“Cryptocurrency quotes also show negative dynamics against the actively decreasing volumes of cryptocurrency trading, as the medium-term vector of movement is still unclear to traders. Everything is changing fast enough.
BTC quotes have broken through the resistance level of $92,000, which may further lead to a decline to $73,000, where strong support in the form of 200 SMA is currently taking place.”
Matteo Bottacini and the Crypto Finance team note Bitcoin’s quick recovery from its dip under $90,000. The first key inflection point for a higher range is $96,800 and BTC is holding steady above support at $92,000.
Technical analysis and Bitcoin price forecast
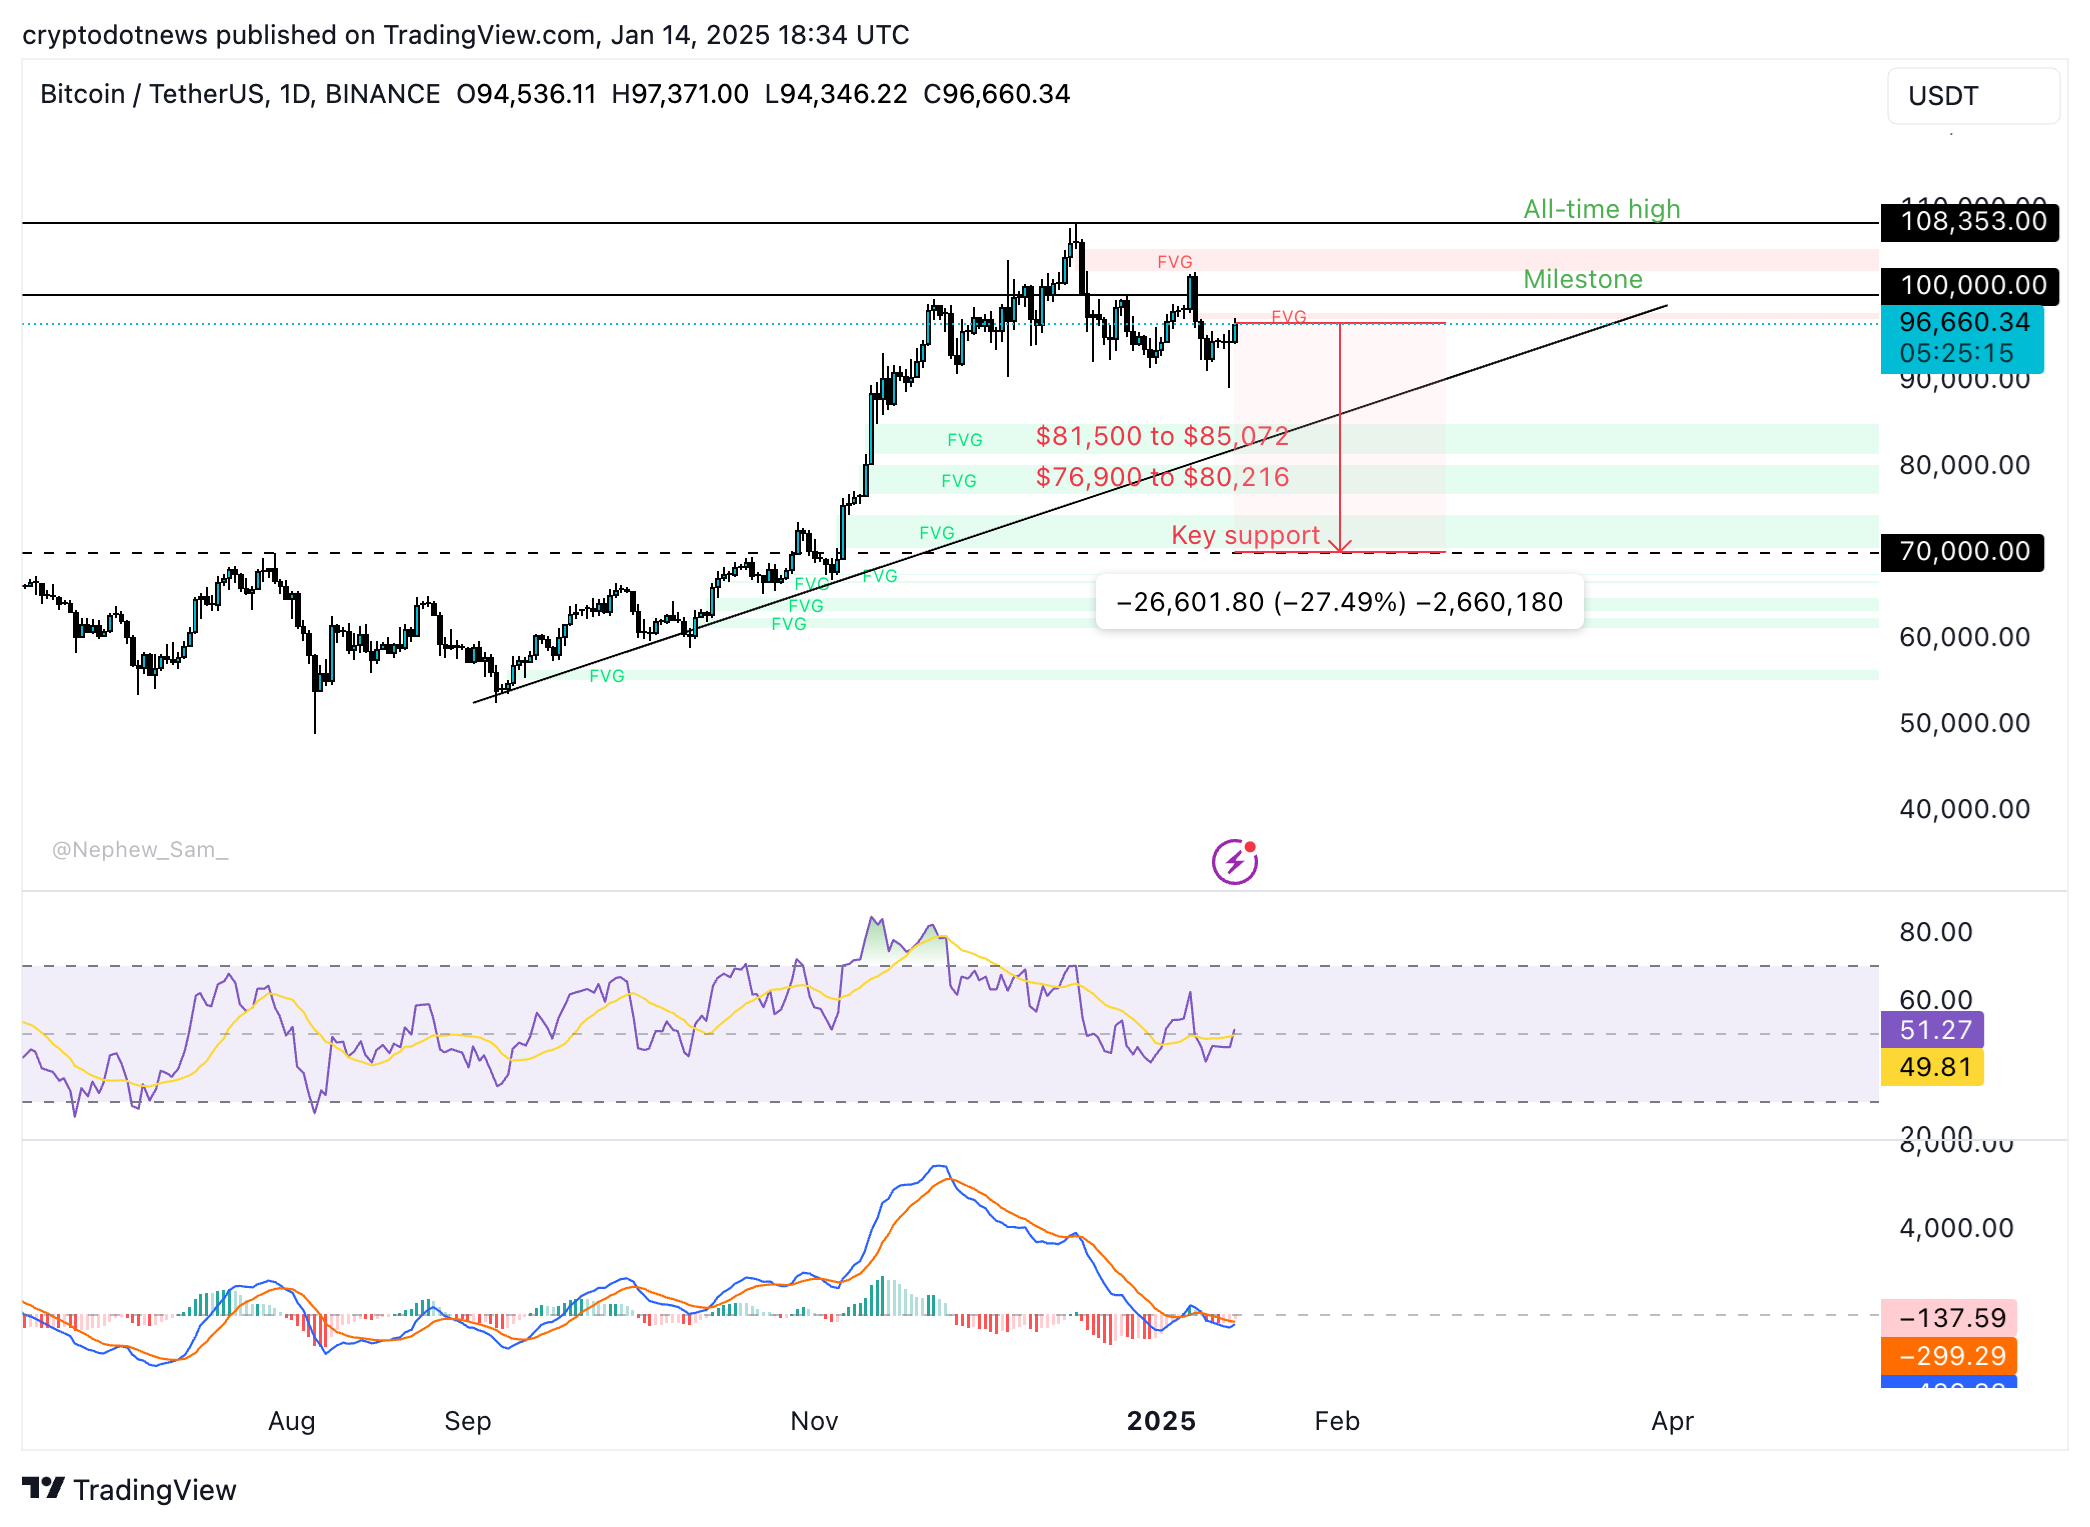
Bitcoin is currently consolidating around the $96,600 level. The BTC/USDT daily price chart shows the formation of two imbalance zones, or support levels for Bitcoin. The first one is between $81,500 and $85,072, and the second lies between $76,900 and $80,216.
The $70,000 level is a key support for Bitcoin and comes into play once BTC fails to bounce from the two support zones and continues its decline.
A 27% drop from the current price could push Bitcoin to test the $70,000 level as support. This could erase all gains in Bitcoin since November 5, 2024, meaning post-election BTC rally would be wiped out.
The Moving average convergence divergence indicator shows red histogram bars under the neutral line, meaning there is negative momentum underlying Bitcoin price trend. Relative strength index reads 51, close to the neutral level at 50.
Disclosure: This article does not represent investment advice. The content and materials featured on this page are for educational purposes only.


