Bitcoin has been on a correction path since it reached a new all-time high of $108,135 on December 17. Notably, this correction has seen the leading cryptocurrency decline by about 10% up until the time of writing and even breaking below $93,000 very quickly.
Related Reading
This notable decline has seen Bitcoin retesting the Bollinger Bands, and technical analysis suggests a bounce from here to reach a price target around $178,000.
Bitcoin Retests Monthly Upper Bollinger Band
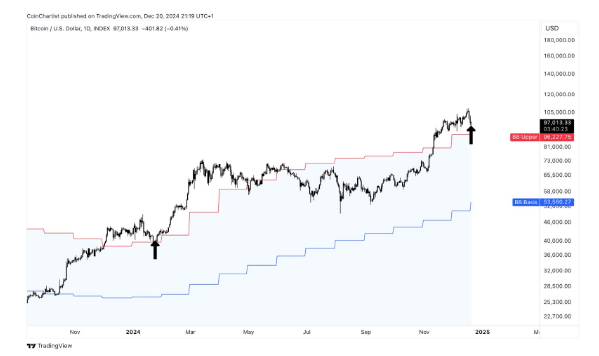
Bitcoin’s recent price correction has caught the eye of crypto analyst Tony Severino, who highlighted a critical retest of the monthly upper Bollinger Band. Sharing his insights on social media platform X, Severino emphasized the significance of this technical indicator, which measures market volatility and potential reversal points.
According to him, this development mirrors a similar pattern observed in January 2024, which eventually led to a substantial rally after a similar retest.
According to the daily candlestick chart shared by Tony Severino, the upper Bollinger Band is currently situated just above $96,000, which is around Bitcoin’s current price. This Bollinger Band retest suggests that Bitcoin might be entering a new phase of upward momentum after the recent corrections.

Historical Echoes: January 2024’s 86% Rally Offers A Blueprint
Severino’s analysis draws parallels between the current price movement and Bitcoin’s behavior earlier in 2024. He noted that in January 2024, a similar retest of the monthly upper Bollinger Band preceded an 86% rally in Bitcoin’s price.
At that time, Bitcoin was trading near $46,000, following a strong price rally that was brought forward from late 2023. However, January saw a brief correction, with Bitcoin’s price dropping to $40,000 to test the upper Bollinger Band. This test acted as a launchpad for not only a continued rally but also pushed Bitcoin to break its then all-time high and surpass $70,000 in March for the first time in its history.
If Bitcoin were to replicate this 86% rally at this point, it could soar to approximately $178,000, which Severino noted is aligning with the upper range of his target zone. In another analysis, the analyst predicted that Bitcoin could reach its market top as early as January 20, 2025.
At the time of writing, Bitcoin is trading $96,402, still hovering around the upper Bollinger Band. Interestingly, the leading cryptocurrency is currently down by 2.11% and 5.4% in the past 24 hours and seven days, respectively.
This pullback has led to the realization of over $5.72 billion in Bitcoin profits, which has added to the short-term selling pressure. The impact of this correction is evident in Bitcoin’s Relative Strength Index (RSI), which has fallen sharply from 69 on December 17 to its current reading of 45.
Related Reading
However, there are reasons to believe that the selling pressure may be easing. This is because the RSI level of 43 has acted as a significant support zone for Bitcoin since September. If this support holds, it could provide the foundation for Bitcoin’s move towards $178,000.
Featured image from ABC News, chart from TradingView


